Get certified for free when you join Fabric Data Days 2026 and dive into Fabric, Power BI, SQL, AI, and other essential data skills.
Join nowJuly 7 - July 17 | Round 2 of the Power BI Dataviz World Championships. Don't miss your chance! Learn more
Dear All,
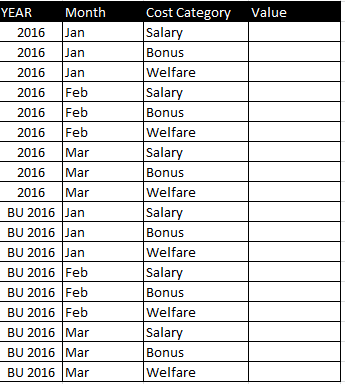
I want to calculate the variance 2016 vs. BU 2016 with a database like below.
What is the most efficient way to proceed? thank you for your support !! Sly
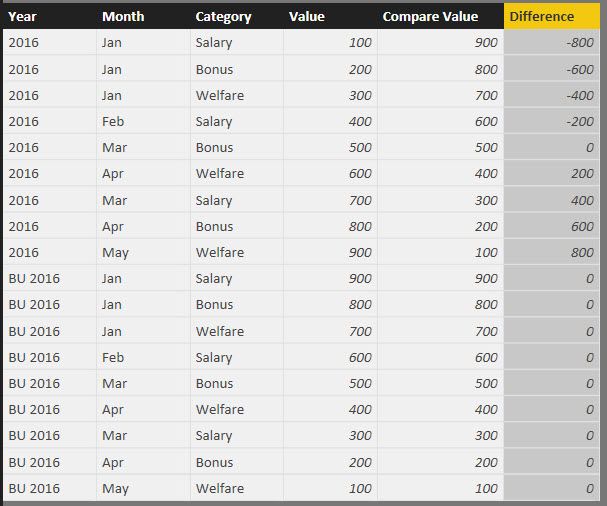
One way to do it is to add another value column that would be a lookup to get the matching BU 2016 value for each 2016 value:
Compare Value = LOOKUPVALUE(Sheet1[Value],[Year],"BU 2016",[Month],[Month],[Category],[Category])
And then a second column for the difference:
Difference = Sheet1[Value]-Sheet1[Compare Value]
For example:
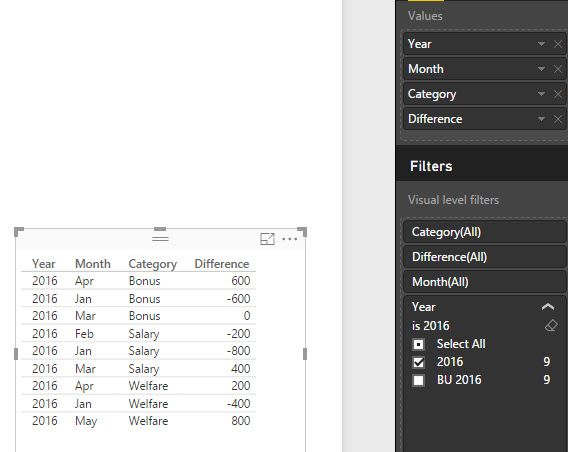
Then you would filter your visual to display only 2016 values, and get this:
Thank you very much for your answer.
Unfortunatelly, my database is more detailled as I have another column called "sub category" wih the name of all the employees...
This subcategory is changing every month (= people leaving or joining the company) so the matching is not possible.
Any other ideas?
Join us in Barcelona for FabCon and SQLCon, the Fabric, Power BI, SQL, and AI community event. Save €200 with code FABCMTY200.
Join Data Days 2026: 60 days of free live/on-demand sessions, challenges, study groups, and certification opportunities.
| User | Count |
|---|---|
| 24 | |
| 10 | |
| 10 | |
| 6 | |
| 4 |
| User | Count |
|---|---|
| 32 | |
| 25 | |
| 18 | |
| 18 | |
| 17 |