Join us at FabCon Vienna from September 15-18, 2025
The ultimate Fabric, Power BI, SQL, and AI community-led learning event. Save €200 with code FABCOMM.
Get registered- Power BI forums
- Get Help with Power BI
- Desktop
- Service
- Report Server
- Power Query
- Mobile Apps
- Developer
- DAX Commands and Tips
- Custom Visuals Development Discussion
- Health and Life Sciences
- Power BI Spanish forums
- Translated Spanish Desktop
- Training and Consulting
- Instructor Led Training
- Dashboard in a Day for Women, by Women
- Galleries
- Data Stories Gallery
- Themes Gallery
- Contests Gallery
- Quick Measures Gallery
- Notebook Gallery
- Translytical Task Flow Gallery
- TMDL Gallery
- R Script Showcase
- Webinars and Video Gallery
- Ideas
- Custom Visuals Ideas (read-only)
- Issues
- Issues
- Events
- Upcoming Events
Compete to become Power BI Data Viz World Champion! First round ends August 18th. Get started.
- Power BI forums
- Forums
- Get Help with Power BI
- Service
- Re: Power BI Export to Excel: Data with current la...
- Subscribe to RSS Feed
- Mark Topic as New
- Mark Topic as Read
- Float this Topic for Current User
- Bookmark
- Subscribe
- Printer Friendly Page
- Mark as New
- Bookmark
- Subscribe
- Mute
- Subscribe to RSS Feed
- Permalink
- Report Inappropriate Content
Power BI Export to Excel: Data with current layout is unavailable for the Last drilled down field
Hi all,
My client usually export data through using "Data with current layout." The function used to work well, but now she met a weried problem. She can't export if she drill down all the fields , but she can do it if she doesn't drill down to the last field.
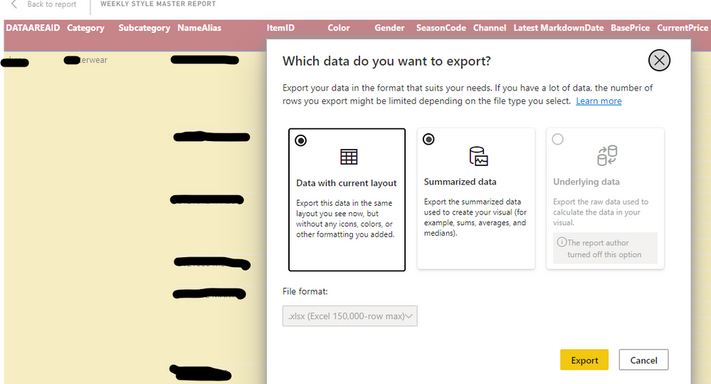
The error message looks like
The report is a matrix and it can be drilled down to the field LandedCost.
If assuming to drill down to FOBCost, a field before LandedCost, the "Data with current layout." functionality runs well.
See Build visual in Desktop. No columns in the PBI Desktop. LandedCost is in the rows.
Besides this problem, she can export the data through the summarized data and underlying data as well.
Another investigation I did is that I checked the official documentation https://docs.microsoft.com/en-us/power-bi/visuals/power-bi-visualization-export-data?tabs=powerbi-de...
This report includes 7,800 rows records in the tabular format. That is far less than the limitation 150,000 rows in xlsx.file or 50,000 rows from matrix visuals. According to the documentation, this is not supposed to be the reason.
I saw many requests regarding this type of problem, but they all refer that Data with current layout doesn't work at all. But my export just partially works. That is so strange.
The solution. I walk around this issue by changing LandedCost from Rows to Values in Desktop. Now it is OK. But my client said she could export even drilled down to LandedCost before. I feel so confused.
Thank anyone who can help out.
Solved! Go to Solution.
- Mark as New
- Bookmark
- Subscribe
- Mute
- Subscribe to RSS Feed
- Permalink
- Report Inappropriate Content
Hi @AnamikaK @XtraTerrestrial ,
This issue has been confirmed as a known issue internally. Internal ICM ID: 324897008.
Please be patient to wait for fixing. If there is any news, I will update it here.
- Mark as New
- Bookmark
- Subscribe
- Mute
- Subscribe to RSS Feed
- Permalink
- Report Inappropriate Content
Hi, I have the same problem - there seems to be a limit of 13 Rows?
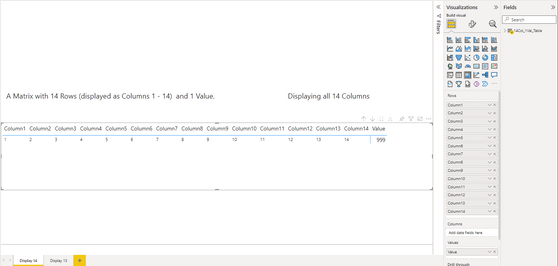
I’ve set up a test scenario as follows:
Then exporting “Data with current layout”:
Which results in the following error:
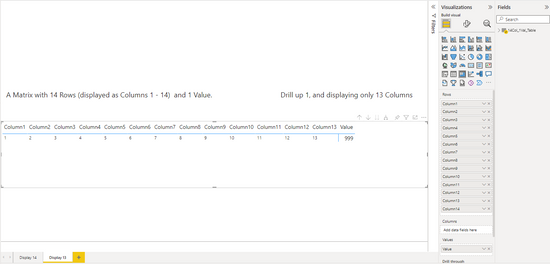
Whereas this setup exports “Data with current layout” successfully?
The only difference is the number of Columns displayed.
Q: Is there currently a limit of 13 Row-Columns displayed for the “Data with current layout” export to work?
Q: Can this limit be increased?
Thanks, regards
ET.
- Mark as New
- Bookmark
- Subscribe
- Mute
- Subscribe to RSS Feed
- Permalink
- Report Inappropriate Content
Hi @v-yadongf-msft,
We are facing similar issue.
When we are selecting a very small subgroup of say max 20 rows in the extract then still we observe the same error.
The main reason is when the rows in the matrix is 13 or less the export runs fine. As soon as we add the 14th row tot he matrix we get the error in the export.
This was working earlier for all our visuals and the users were able to export data. Now we are getting a lot of feedback that this has stopped working. Would be great to hear back on this 🙂 . Thanks
- Mark as New
- Bookmark
- Subscribe
- Mute
- Subscribe to RSS Feed
- Permalink
- Report Inappropriate Content
The problem is that when "Expand all down one level in the hierarchy" exceeds a certain number, an export error occurs. it might be.
- Mark as New
- Bookmark
- Subscribe
- Mute
- Subscribe to RSS Feed
- Permalink
- Report Inappropriate Content
Hi @PBI-Learner ,
Based on your description, I created a matrix similar to yours with 7800 rows.
In my test, it exports fine as data with current lay out.
Here are some suggestions for you to answer your confusion:
1.Are you using directquery mode? When you're using DirectQuery, the maximum amount of data that Power BI can export is 16-MB uncompressed data. An unintended result may be that you export less than the maximum number of rows of 150,000. As you said, your report includes 7,800 rows records in the tabular format, please check your data size.
2.Maybe there are too many rows. So when you changed LandedCost from Rows to Values, it worked.
3.For export from matrix visuals using Data with current layout, consider the following:
(1)Matrices with columns and/or values but no rows will be exported as having rows and/or values but no columns.
(2)Matrices with only one row and/or values but no columns will be exported as table (no right border separator).
(3)If the Show on rows toggle is set to 'On' in Power BI Desktop for a table or matrix visual, the visual format would not be preserved when data is exported to Excel.
(4)If the Row subtotals toggle is set to 'Off' in Power BI Desktop for a matrix visual, but the matrix visual has expanded and collapsed sections, exported data will contain subtotals for rows. To work around this issue, use the Expand | All command from the visual's context menu.
For more information, please refer to: Export data from a Power BI visualization - Power BI | Microsoft Docs
Best Regards,
Yadong Fang
If this post helps, then please consider Accept it as the solution to help the other members find it more quickly.
- Mark as New
- Bookmark
- Subscribe
- Mute
- Subscribe to RSS Feed
- Permalink
- Report Inappropriate Content
Thank @v-yadongf-msft for your reply!
1. I am not using directquery mode. I am using SQL statement instead.
2. This might be the reason for the issue. I have 13 rows except for LandedCost, meaning I have total 14 rows to expand. Before I posted this request, I put all 14 rows in the report, and my client could download data with layout. Now I have to put the LandedCost into Values and this works. I doubt it might be row number's issue, but the weird thing is it worked before. I saw your posting "This issue has been confirmed as a known issue internally. Internal ICM ID: 324897008." That's great but I also found another issue.
I put the 14th rows i.e. LandedCost from Values to Rows again on the PBI Desktop side.
The report can be drilled down to LandedCost correctly.
However, once I published it and moved to PBI Services side, I couldn't find LandedCost row.
Please notice the drill down icon . It still shows it is clickable.
But in reality, after I clicked it, it doesn't show LandedCost though.
Has MS been fixing the previous issue and eventually decides to set the number of rows to 13?
Thank everyone who assisted again!


