Huge last-minute discounts for FabCon Vienna from September 15-18, 2025
Supplies are limited. Contact info@espc.tech right away to save your spot before the conference sells out.
Get your discount- Power BI forums
- Get Help with Power BI
- Desktop
- Service
- Report Server
- Power Query
- Mobile Apps
- Developer
- DAX Commands and Tips
- Custom Visuals Development Discussion
- Health and Life Sciences
- Power BI Spanish forums
- Translated Spanish Desktop
- Training and Consulting
- Instructor Led Training
- Dashboard in a Day for Women, by Women
- Galleries
- Data Stories Gallery
- Themes Gallery
- Contests Gallery
- Quick Measures Gallery
- Notebook Gallery
- Translytical Task Flow Gallery
- TMDL Gallery
- R Script Showcase
- Webinars and Video Gallery
- Ideas
- Custom Visuals Ideas (read-only)
- Issues
- Issues
- Events
- Upcoming Events
Score big with last-minute savings on the final tickets to FabCon Vienna. Secure your discount
- Power BI forums
- Forums
- Get Help with Power BI
- Service
- Line Chart not rendering correctly with multiple l...
- Subscribe to RSS Feed
- Mark Topic as New
- Mark Topic as Read
- Float this Topic for Current User
- Bookmark
- Subscribe
- Printer Friendly Page
- Mark as New
- Bookmark
- Subscribe
- Mute
- Subscribe to RSS Feed
- Permalink
- Report Inappropriate Content
Line Chart not rendering correctly with multiple lines
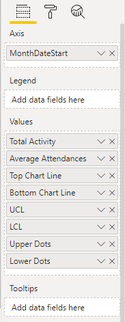
I have created my own Statistical Process Chart in Power BI - it is effectively a line chart with many lines (8 in this instance, some of them invisible/white and some are clear lines with only markers.
The chart renders perfectly in Desktop:
However, when this is published to Power BI Service and then published to web, the markers disappear:
If anyone is able to help, I would be greatful.
Solved! Go to Solution.
- Mark as New
- Bookmark
- Subscribe
- Mute
- Subscribe to RSS Feed
- Permalink
- Report Inappropriate Content
Strange. It could be a browser issue. Perhaps try a different browser and see. Also, try in the Mobile app. If it still doesn’t work, I suggest you open a ticket.
* Matt is an 8 times Microsoft MVP (Power BI) and author of the Power BI Book Supercharge Power BI.
I will not give you bad advice, even if you unknowingly ask for it.
- Mark as New
- Bookmark
- Subscribe
- Mute
- Subscribe to RSS Feed
- Permalink
- Report Inappropriate Content
Thank you Matt.. Having run it on three browsers it seems to be an isolated issue with Microsoft browsers Edge version 38.14393.1066.0 and Internet Explorer.
It does however, work on Google Chrome.


