This is best Fabric, Power BI, SQL and AI community event. How do we know? The last event sold out! Save €200 with code FABCMTY200.
Register nowA new Data Days event is coming soon! This time we’re going bigger than ever. Fabric, Power BI, SQL, AI and more. Don't miss out.
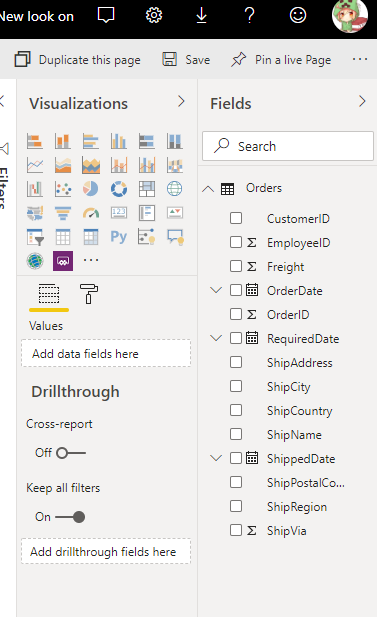
Expand the Fields and Visualizations pane on the right of the screen can't see the fields and visualizations pane
Solved! Go to Solution.
HI @bdori ,
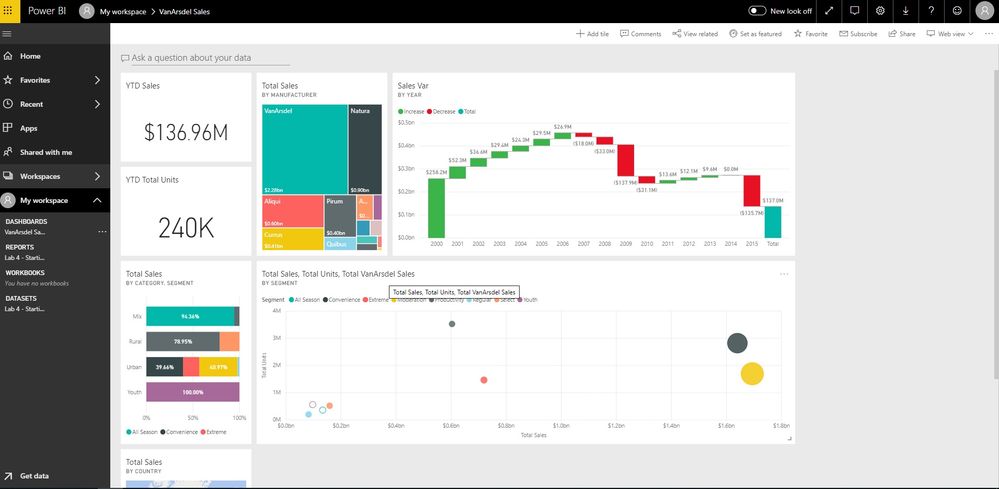
Visualizations and fields not available on the dashboard side, you can enter to 'report view -> edit' to find them.
Interact with a report in Editing view in Power BI service
Regards,
Xiaoxin Sheng
HI @bdori ,
I can't reproduce your issue, these panels works well on my side, can you please share some detail information?
How to Get Your Question Answered Quickly
Regards,
Xiaoxin Sheng
As shown in the screenshot on the right-hand side there are no visualizations and fields
HI @bdori ,
Visualizations and fields not available on the dashboard side, you can enter to 'report view -> edit' to find them.
Interact with a report in Editing view in Power BI service
Regards,
Xiaoxin Sheng
Check out the May 2026 Power BI update to learn about new features.
Sign up to receive a private message when registration opens and key events begin.
If you have recently started exploring Fabric, we'd love to hear how it's going. Your feedback can help with product improvements.
| User | Count |
|---|---|
| 10 | |
| 8 | |
| 7 | |
| 6 | |
| 6 |
| User | Count |
|---|---|
| 24 | |
| 23 | |
| 21 | |
| 19 | |
| 16 |