Get certified for free when you join Fabric Data Days 2026 and dive into Fabric, Power BI, SQL, AI, and other essential data skills.
Join nowJuly 7 - July 17 | Round 2 of the Power BI Dataviz World Championships. Don't miss your chance! Learn more
Hello experts,
I have a report that has been embedded in the company portal and is consumed by the end users that way.
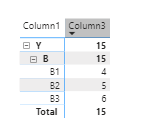
One of the visuals conain a matrix. Let's suppose the matrix viz looks something like this
| column1 | column2 | column3 | column4 | measure1 | measure2 |
| X | Y | Z | A | 1 | 2 |
When the end users drill up to this level
| column1 | column2 | column3 | measure1 | measure2 |
| X | Y | Z | 1 | 2 |
or
| column1 | column2 | measure1 | measure2 |
| X | Y | 1 | 2 |
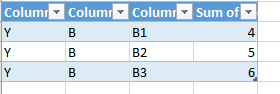
and export to excel
they still get this
| column1 | column2 | column3 | column4 | measure1 | measure2 |
| X | Y | Z | A | 1 | 2 |
I am not sure why it keeps on happening. Is it by default / is there a work around to this.
Reports will be consumed through embedded in the portal and not through app.powerbi in my case.
Thank you in advance !!!
Join us in Barcelona for FabCon and SQLCon, the Fabric, Power BI, SQL, and AI community event. Save €200 with code FABCMTY200.
Join Data Days 2026: 60 days of free live/on-demand sessions, challenges, study groups, and certification opportunities.
| User | Count |
|---|---|
| 23 | |
| 12 | |
| 10 | |
| 10 | |
| 4 |
| User | Count |
|---|---|
| 32 | |
| 31 | |
| 27 | |
| 26 | |
| 21 |