Become a Certified Power BI Data Analyst!
Join us for an expert-led overview of the tools and concepts you'll need to pass exam PL-300. The first session starts on June 11th. See you there!
Get registered- Power BI forums
- Get Help with Power BI
- Desktop
- Service
- Report Server
- Power Query
- Mobile Apps
- Developer
- DAX Commands and Tips
- Custom Visuals Development Discussion
- Health and Life Sciences
- Power BI Spanish forums
- Translated Spanish Desktop
- Training and Consulting
- Instructor Led Training
- Dashboard in a Day for Women, by Women
- Galleries
- Webinars and Video Gallery
- Data Stories Gallery
- Themes Gallery
- Contests Gallery
- Quick Measures Gallery
- Notebook Gallery
- Translytical Task Flow Gallery
- R Script Showcase
- Ideas
- Custom Visuals Ideas (read-only)
- Issues
- Issues
- Events
- Upcoming Events
Power BI is turning 10! Let’s celebrate together with dataviz contests, interactive sessions, and giveaways. Register now.
- Power BI forums
- Forums
- Get Help with Power BI
- Service
- Deviation between unpublished and published report
- Subscribe to RSS Feed
- Mark Topic as New
- Mark Topic as Read
- Float this Topic for Current User
- Bookmark
- Subscribe
- Printer Friendly Page
- Mark as New
- Bookmark
- Subscribe
- Mute
- Subscribe to RSS Feed
- Permalink
- Report Inappropriate Content
Deviation between unpublished and published report
Hi,
First: I'm a newbie PowerBI, so I hope you guys will be understanding of my lack of competence.
My problem is that my data in my PowerBI file works superb while using the desktop application. However, the published version shows different data than my desktop version.
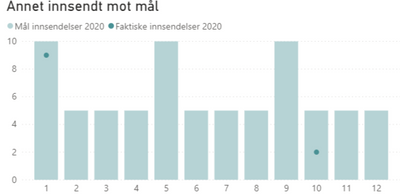
I attached a snip from both the report from powerbi.com and from the project file, see below. As you can see the from the online version data is registered in month 1 and 10. According to the project file, data is registered in month 1 and 2, which in this case is correct. The problem seems to solely happen when i'm working with dates. Sadly the project file contains a lot of sensitive information, and I am therefore not able to share it here.
Could anyone help me out a bit here?
Some additional information: My powerBI application is in norwegian, could this maybe cause the problem?
From powerbi.com:
From project file:
- Mark as New
- Bookmark
- Subscribe
- Mute
- Subscribe to RSS Feed
- Permalink
- Report Inappropriate Content
Does nobody have a clue here?
Would really appreciate all the help I could get.
- Mark as New
- Bookmark
- Subscribe
- Mute
- Subscribe to RSS Feed
- Permalink
- Report Inappropriate Content
So, you are saying that if you refresh your data in Desktop and your visual looks like the bottom image that if you then Publish the report to the Service and then go look at the report (not a dashboard tile) that your visual in the Service looks like the top image?
Follow on LinkedIn
@ me in replies or I'll lose your thread!!!
Instead of a Kudo, please vote for this idea
Become an expert!: Enterprise DNA
External Tools: MSHGQM
YouTube Channel!: Microsoft Hates Greg
Latest book!: Power BI Cookbook Third Edition (Color)
DAX is easy, CALCULATE makes DAX hard...
- Mark as New
- Bookmark
- Subscribe
- Mute
- Subscribe to RSS Feed
- Permalink
- Report Inappropriate Content
That is correct.
Helpful resources

Join our Fabric User Panel
This is your chance to engage directly with the engineering team behind Fabric and Power BI. Share your experiences and shape the future.

Power BI Monthly Update - June 2025
Check out the June 2025 Power BI update to learn about new features.

| User | Count |
|---|---|
| 50 | |
| 31 | |
| 26 | |
| 26 | |
| 25 |
| User | Count |
|---|---|
| 61 | |
| 56 | |
| 33 | |
| 29 | |
| 27 |


