Become a Certified Power BI Data Analyst!
Join us for an expert-led overview of the tools and concepts you'll need to pass exam PL-300. The first session starts on June 11th. See you there!
Get registered- Power BI forums
- Get Help with Power BI
- Desktop
- Service
- Report Server
- Power Query
- Mobile Apps
- Developer
- DAX Commands and Tips
- Custom Visuals Development Discussion
- Health and Life Sciences
- Power BI Spanish forums
- Translated Spanish Desktop
- Training and Consulting
- Instructor Led Training
- Dashboard in a Day for Women, by Women
- Galleries
- Webinars and Video Gallery
- Data Stories Gallery
- Themes Gallery
- Contests Gallery
- Quick Measures Gallery
- Notebook Gallery
- Translytical Task Flow Gallery
- R Script Showcase
- Ideas
- Custom Visuals Ideas (read-only)
- Issues
- Issues
- Events
- Upcoming Events
Power BI is turning 10! Let’s celebrate together with dataviz contests, interactive sessions, and giveaways. Register now.
- Power BI forums
- Forums
- Get Help with Power BI
- Service
- Re: Can active Filter info be embedded in a visual...
- Subscribe to RSS Feed
- Mark Topic as New
- Mark Topic as Read
- Float this Topic for Current User
- Bookmark
- Subscribe
- Printer Friendly Page
- Mark as New
- Bookmark
- Subscribe
- Mute
- Subscribe to RSS Feed
- Permalink
- Report Inappropriate Content
Can active Filter info be embedded in a visual?
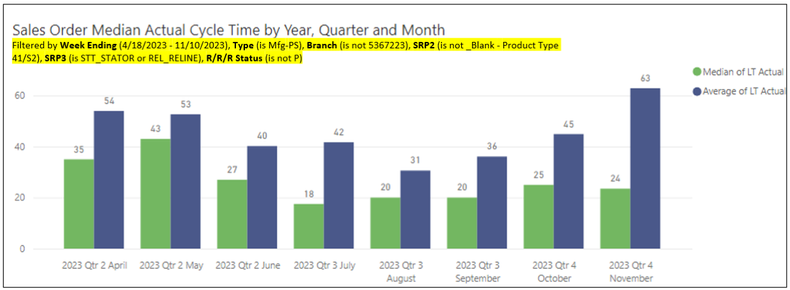
Is it possible to embed the active filter info into a visual (as in the highlight in the capture)? This would help with dashboard creation and use, especially if the same visual is put into a dashboard multiple times with different filter criteria applied to each. I know this can be done when copying and pasting a visual out of the service, but I want to have the same info visible within a visual that is in a dashboard.
Solved! Go to Solution.
- Mark as New
- Bookmark
- Subscribe
- Mute
- Subscribe to RSS Feed
- Permalink
- Report Inappropriate Content
And the other problem is that you have to specify every filter individually, which can be a real problem if there are dozens of filters. This solves that problem using DAX Studio. Take the results they put into a tooltip, and instead put that measure into the subtitle. Voila!
- Mark as New
- Bookmark
- Subscribe
- Mute
- Subscribe to RSS Feed
- Permalink
- Report Inappropriate Content
Yes, you can use below
Filters Selected =
IF (
ISFILTERED ( MyTable[MyColumn] ),
CONCATENATEX ( FILTERS ( MyTable[MyColumn] ), MyTable[MyColumn], ", " ),
"ALL"
)
For detailed tutorial refer https://www.datapears.com/post/creative-ways-to-show-filter-selections-on-your-power-bi-reports
If this post helps, then please consider Accept it as the solution, Appreciate your Kudos!!
Proud to be a Super User!!
- Mark as New
- Bookmark
- Subscribe
- Mute
- Subscribe to RSS Feed
- Permalink
- Report Inappropriate Content
Unfortunately, that appears to try to solve the problem by creating a second visual dedicated only to showing the filter info. However, you led me to a solution that keeps the filter info in the main visual. Using your DAX, the measure can be added within a visual via the subtitle function in the Visualizations Pane>Format>General>Subtitle option.
- Mark as New
- Bookmark
- Subscribe
- Mute
- Subscribe to RSS Feed
- Permalink
- Report Inappropriate Content
And the other problem is that you have to specify every filter individually, which can be a real problem if there are dozens of filters. This solves that problem using DAX Studio. Take the results they put into a tooltip, and instead put that measure into the subtitle. Voila!
Helpful resources

Join our Fabric User Panel
This is your chance to engage directly with the engineering team behind Fabric and Power BI. Share your experiences and shape the future.

Power BI Monthly Update - June 2025
Check out the June 2025 Power BI update to learn about new features.

| User | Count |
|---|---|
| 49 | |
| 32 | |
| 27 | |
| 27 | |
| 26 |
| User | Count |
|---|---|
| 61 | |
| 56 | |
| 34 | |
| 29 | |
| 28 |


