Join us in Barcelona for FabCon and SQLCon, September 28 - October 1, 2026.
This is best Fabric, Power BI, SQL and AI community event. How do we know? The last event sold out! Save €200 with code FABCMTY200.
Register now- Power BI forums
- Get Help with Power BI
- Desktop
- Service
- Report Server
- Power Query
- Mobile Apps
- Developer
- DAX Commands and Tips
- Custom Visuals Development Discussion
- Health and Life Sciences
- Power BI Spanish forums
- Translated Spanish Desktop
- Training and Consulting
- Instructor Led Training
- Dashboard in a Day for Women, by Women
- Galleries
- Data Stories Gallery
- Themes Gallery
- Contests Gallery
- QuickViz Gallery
- Quick Measures Gallery
- Visual Calculations Gallery
- Fabric Apps Gallery
- Notebook Gallery
- Translytical Task Flow Gallery
- TMDL Gallery
- R Script Showcase
- Webinars and Video Gallery
- Ideas
- Custom Visuals Ideas (read-only)
- Issues
- Issues
- Events
- Upcoming Events
The Fabric community is upgrading! Read all of the details including the timeline and what you can expect. Learn more
- Power BI forums
- Galleries
- R Script Showcase
- Combined Area - Bar - Scatter Plot
Your file has been submitted successfully. We’re processing it now - please check back in a few minutes to view your report.
Combined Area - Bar - Scatter Plot
09-20-2016 20:13 PM - last edited 09-23-2016 09:53 AM



- Mark as New
- Bookmark
- Subscribe
- Mute
- Subscribe to RSS Feed
- Permalink
- Report Inappropriate Content
Combined Area - Bar - Scatter Plot
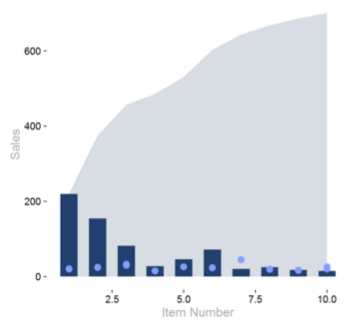
Description
Adding Multiple chart types on one graph can be necessary to compare various variables.
Learn It
Want to see exactly how I built this visual? Check out my Tutorial on PowerBI.Tips which explains how to create this visual step by step, with detailed explainations about the R code. Enjoy!
Prerequisites (The sample .pbix files won't work without installing the following)
1. Install R Engine
Power BI does not include the R engine. Therefore, a seperate installation is required to install R on your local computer. You can download R from the Revolution Open download page, and through the CRAN Repository.
2. Install the R packages
Once R engine has been installed you can dowload the package from the Revolution Open Package Downloads Page.
Required R Packages
ggplot2
Tested on
MRO 3.3.1, CRAN 3.3.1

