Join us in Barcelona for FabCon and SQLCon, September 28 - October 1, 2026.
This is best Fabric, Power BI, SQL and AI community event. How do we know? The last event sold out! Save €200 with code FABCMTY200.
Register now- Power BI forums
- Get Help with Power BI
- Desktop
- Service
- Report Server
- Power Query
- Mobile Apps
- Developer
- DAX Commands and Tips
- Custom Visuals Development Discussion
- Health and Life Sciences
- Power BI Spanish forums
- Translated Spanish Desktop
- Training and Consulting
- Instructor Led Training
- Dashboard in a Day for Women, by Women
- Galleries
- Data Stories Gallery
- Themes Gallery
- Contests Gallery
- QuickViz Gallery
- Quick Measures Gallery
- Visual Calculations Gallery
- Notebook Gallery
- Translytical Task Flow Gallery
- TMDL Gallery
- R Script Showcase
- Webinars and Video Gallery
- Ideas
- Custom Visuals Ideas (read-only)
- Issues
- Issues
- Events
- Upcoming Events
A new Data Days event is coming soon! This time we’re going bigger than ever. Fabric, Power BI, SQL, AI and more. Don't miss out.
- Power BI forums
- Galleries
- R Script Showcase
- Baseball Analytics With R
Your file has been submitted successfully. We’re processing it now - please check back in a few minutes to view your report.


- Mark as New
- Bookmark
- Subscribe
- Mute
- Subscribe to RSS Feed
- Permalink
- Report Inappropriate Content
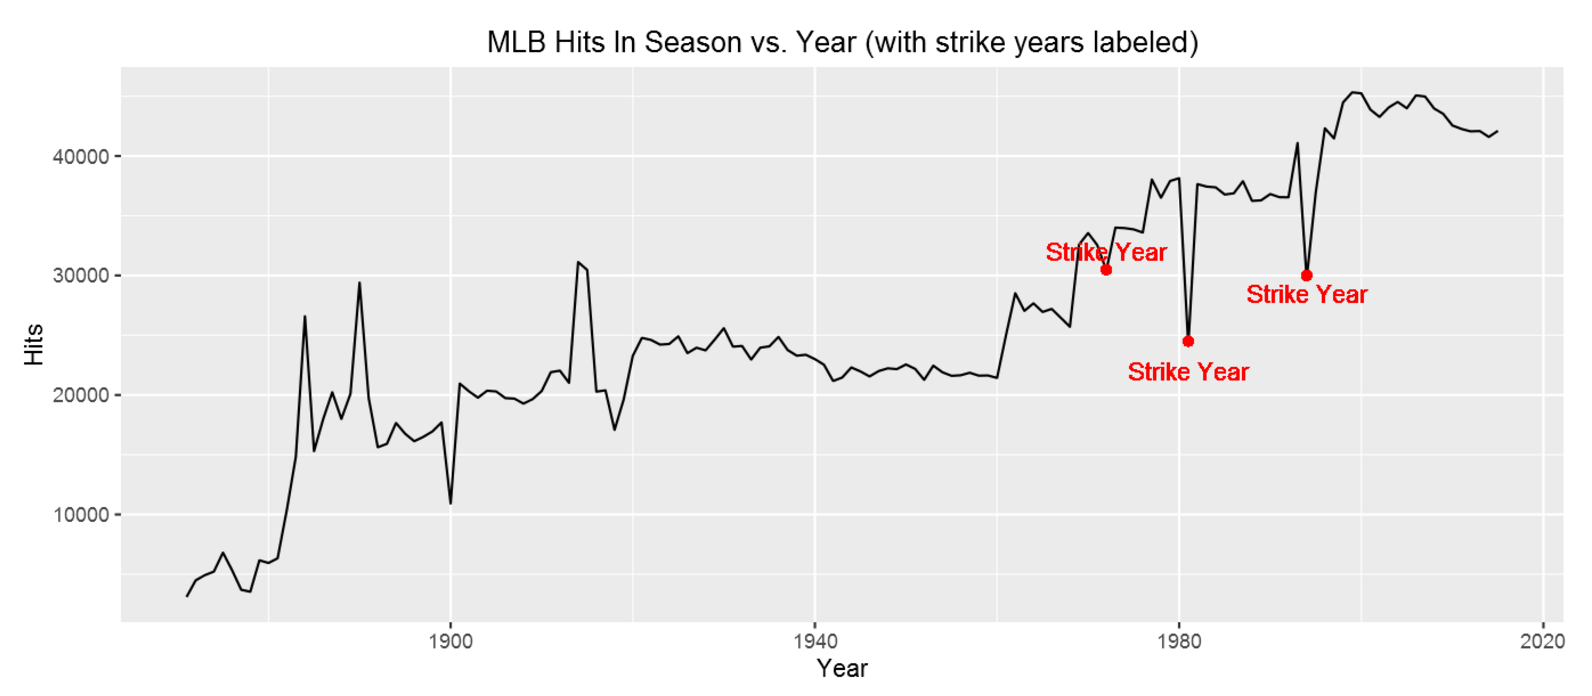
Baseball Analytics With R
In this Power BI dashboard, Power BI data visualizations are showcased interacting with R Script Visuals.
The data used is baseball batting statistics from the last 120+ years. In this example, several interactions are shown how to craft dashboards blending both Power BI data visualizations and Script R visuals.
- Mark as New
- Bookmark
- Subscribe
- Mute
- Subscribe to RSS Feed
- Permalink
- Report Inappropriate Content
Can you check your attached PBIX file? I downloaded it, but there is no PBIX files from that zip file. Thanks.