FabCon is coming to Atlanta
Join us at FabCon Atlanta from March 16 - 20, 2026, for the ultimate Fabric, Power BI, AI and SQL community-led event. Save $200 with code FABCOMM.
Register now!- Power BI forums
- Get Help with Power BI
- Desktop
- Service
- Report Server
- Power Query
- Mobile Apps
- Developer
- DAX Commands and Tips
- Custom Visuals Development Discussion
- Health and Life Sciences
- Power BI Spanish forums
- Translated Spanish Desktop
- Training and Consulting
- Instructor Led Training
- Dashboard in a Day for Women, by Women
- Galleries
- Data Stories Gallery
- Themes Gallery
- Contests Gallery
- QuickViz Gallery
- Quick Measures Gallery
- Visual Calculations Gallery
- Notebook Gallery
- Translytical Task Flow Gallery
- TMDL Gallery
- R Script Showcase
- Webinars and Video Gallery
- Ideas
- Custom Visuals Ideas (read-only)
- Issues
- Issues
- Events
- Upcoming Events
The Power BI Data Visualization World Championships is back! Get ahead of the game and start preparing now! Learn more
- Power BI forums
- Forums
- Get Help with Power BI
- Power Query
- Re: Splitting one column in multiple tables based ...
- Subscribe to RSS Feed
- Mark Topic as New
- Mark Topic as Read
- Float this Topic for Current User
- Bookmark
- Subscribe
- Printer Friendly Page
- Mark as New
- Bookmark
- Subscribe
- Mute
- Subscribe to RSS Feed
- Permalink
- Report Inappropriate Content
Splitting one column in multiple tables based on text in rows containing specified text
I have a simple CSV file, which is updated weekly, adding new data to the file
The file contains agregated data with both time periods; Daily, weekly and monthly downloads. However all the data in placed in Column A, and the Daily, weekly and monthly downloads are just seperated by a row with the time period
How do I split column A, into 3 tables, one for each time period, an get all the daily, weeekly and monthly downloads as seperate tables or columns ?
Solved! Go to Solution.
- Mark as New
- Bookmark
- Subscribe
- Mute
- Subscribe to RSS Feed
- Permalink
- Report Inappropriate Content
Import your dataset csv to this format and name whole your dataset query as "WholeDataset"
Then create blank query and paste there whole my code. Edit only 1st step to this:
Source = WholeDataset,
- Mark as New
- Bookmark
- Subscribe
- Mute
- Subscribe to RSS Feed
- Permalink
- Report Inappropriate Content
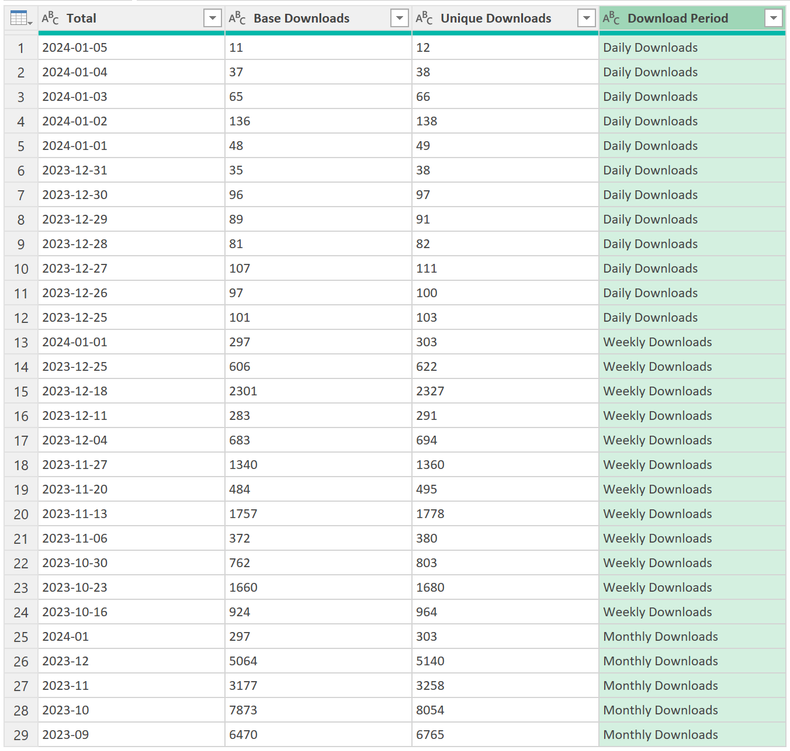
You can easily achive this and filter last column as you wish.
let
    Source = Table.FromRows(Json.Document(Binary.Decompress(Binary.FromText("fZPNasMwEIRfpfhsw/5IK+lacu2tpYckB0MDDQ0xISmlb19ptUmwTHPdT7PWzMjrdfc6XcZDv+mex/PuaTX9HA/T+HHedHn0dtyfvmfDbtuvC0FJIk4PkScOZGg17g+/d0Hf65SA3AA4gC9SVBleJTfo8pSDQo4t5DwVr1CkhVT2sdS9Sy3msYtKXbpDHpAGLpD94qsVQp6mujeFBlLK05gqxBbGAqvTSC0M5Z5QrSIutGKf01PQUs0QLERgw++73dej5ItNsqV8U82WClSnQu2Fsbghto8SU5sF6vrIlS/S0GrFsCQ3w2h5sAMrUKA9ANqgswp9g7E8DgzeIgshNgdA9GmRtTxfD7XmIBXHJhwYSNeL2PVkoUctjOr1klztvUzHy+f/nTwqJM882P/l0TV5FEV2WaXk527VSwxsZvwsbChvVlyoViSIRrn9Aw==", BinaryEncoding.Base64), Compression.Deflate)), let _t = ((type nullable text) meta [Serialized.Text = true]) in type table [Column1 = _t]),
    #"Split Column by Delimiter" = Table.SplitColumn(Source, "Column1", Splitter.SplitTextByDelimiter(",", QuoteStyle.Csv), {"Column1.1", "Column1.2", "Column1.3"}),
    #"Promoted Headers" = Table.PromoteHeaders(#"Split Column by Delimiter", [PromoteAllScalars=true]),
    #"Filtered Rows" = Table.SelectRows(#"Promoted Headers", each ([Total] <> "")),
    Ad_DownloadPeriod = Table.AddColumn(#"Filtered Rows", "Download Period", each if List.Contains({"daily downloads", "weekly downloads", "monthly downloads"}, [Total], Comparer.OrdinalIgnoreCase) then [Total] else null, type text),
    #"Filled Down" = Table.FillDown(Ad_DownloadPeriod,{"Download Period"}),
    #"Filtered Rows1" = Table.SelectRows(#"Filled Down", each not Text.Contains(Text.Lower([Total]), "downloads"))
in
    #"Filtered Rows1"
- Mark as New
- Bookmark
- Subscribe
- Mute
- Subscribe to RSS Feed
- Permalink
- Report Inappropriate Content
Great, that worked on the sample data, with 33 rows of data. However, when I apply this script upon the master data set, which has +2700 rows ...and counting, I only seem to the results for the sample data set - which is 33 rows
- Mark as New
- Bookmark
- Subscribe
- Mute
- Subscribe to RSS Feed
- Permalink
- Report Inappropriate Content
- Mark as New
- Bookmark
- Subscribe
- Mute
- Subscribe to RSS Feed
- Permalink
- Report Inappropriate Content
It appears that you are referrring to a JSON object, while I have the complete data set as seperate CSV file. I tried to replace the reference to the JSON object, but that backfired 🙂 (Due to co company policy, I have limited option to any file sharing services)
- Mark as New
- Bookmark
- Subscribe
- Mute
- Subscribe to RSS Feed
- Permalink
- Report Inappropriate Content
Import your dataset csv to this format and name whole your dataset query as "WholeDataset"
Then create blank query and paste there whole my code. Edit only 1st step to this:
Source = WholeDataset,
- Mark as New
- Bookmark
- Subscribe
- Mute
- Subscribe to RSS Feed
- Permalink
- Report Inappropriate Content
I get error message, when I try to replace the source. Can you please clearyfi, where I need to change the source reference:
- Mark as New
- Bookmark
- Subscribe
- Mute
- Subscribe to RSS Feed
- Permalink
- Report Inappropriate Content
- Mark as New
- Bookmark
- Subscribe
- Mute
- Subscribe to RSS Feed
- Permalink
- Report Inappropriate Content
SUCCESS !!! beautifull- Thanks
- Mark as New
- Bookmark
- Subscribe
- Mute
- Subscribe to RSS Feed
- Permalink
- Report Inappropriate Content
= Table.Group(
        your_table, "Column1",
        {"rows", each _},
        GroupKind.Local,
        (s, c) => Byte.From(Text.Contains(c, "downloads", Comparer.OrdinalIgnoreCase))
)- Mark as New
- Bookmark
- Subscribe
- Mute
- Subscribe to RSS Feed
- Permalink
- Report Inappropriate Content
- Mark as New
- Bookmark
- Subscribe
- Mute
- Subscribe to RSS Feed
- Permalink
- Report Inappropriate Content
- Mark as New
- Bookmark
- Subscribe
- Mute
- Subscribe to RSS Feed
- Permalink
- Report Inappropriate Content
@NorMar
Pasting an image of your data will not help, please share your CSB file.
You can save the file on Google Drive or any other cloud storage platform and provide the link here. Kindly ensure that permission is granted to open the file.
⭕ Subscribe and learn Power BI from these videos
⚪ Website ⚪ LinkedIn ⚪ PBI User Group
- Mark as New
- Bookmark
- Subscribe
- Mute
- Subscribe to RSS Feed
- Permalink
- Report Inappropriate Content
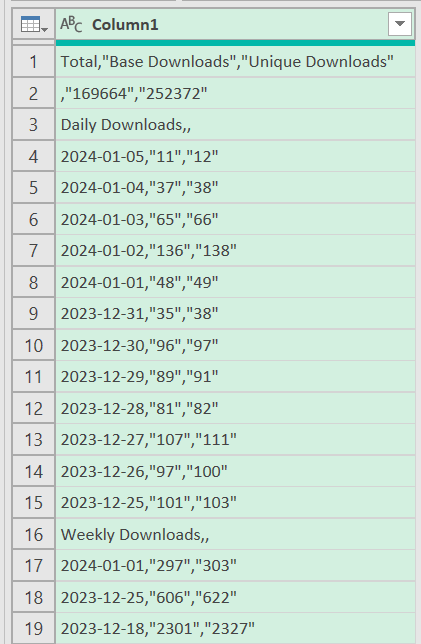
@Fowmy Raw table data
Total,"Base Downloads","Unique Downloads"
,"169664","252372"
Daily Downloads,,
2024-01-05,"11","12"
2024-01-04,"37","38"
2024-01-03,"65","66"
2024-01-02,"136","138"
2024-01-01,"48","49"
2023-12-31,"35","38"
2023-12-30,"96","97"
2023-12-29,"89","91"
2023-12-28,"81","82"
2023-12-27,"107","111"
2023-12-26,"97","100"
2023-12-25,"101","103"
Weekly Downloads,,
2024-01-01,"297","303"
2023-12-25,"606","622"
2023-12-18,"2301","2327"
2023-12-11,"283","291"
2023-12-04,"683","694"
2023-11-27,"1340","1360"
2023-11-20,"484","495"
2023-11-13,"1757","1778"
2023-11-06,"372","380"
2023-10-30,"762","803"
2023-10-23,"1660","1680"
2023-10-16,"924","964"
Monthly Downloads,,
2024-01,"297","303"
2023-12,"5064","5140"
2023-11,"3177","3258"
2023-10,"7873","8054"
2023-09,"6470","6765"
- Mark as New
- Bookmark
- Subscribe
- Mute
- Subscribe to RSS Feed
- Permalink
- Report Inappropriate Content
@NorMar
I think, @AlienSx has provided a neat and performant solution. I have just used his code and created a PBIX file to demontrate how you can create the required three tables based on the CSV file.
Please find attached the PBIX and the Source file, chagne the file path.
If this works for you, accept the orginal solution provided by @AlienSx and if you appreceate my contiribtion, accept mine as well, as a solution.
⭕ Subscribe and learn Power BI from these videos
⚪ Website ⚪ LinkedIn ⚪ PBI User Group
- Mark as New
- Bookmark
- Subscribe
- Mute
- Subscribe to RSS Feed
- Permalink
- Report Inappropriate Content
Thanks - This also works really nice. Huge thanks for the help 🙂
Helpful resources

Power BI Dataviz World Championships
The Power BI Data Visualization World Championships is back! Get ahead of the game and start preparing now!

Power BI Monthly Update - November 2025
Check out the November 2025 Power BI update to learn about new features.


