cancel
Showing results for 
Search instead for 
Did you mean: 

July 7 - July 17 | Round 2 of the Power BI Dataviz World Championships. Don't miss your chance! Learn more

Reply
jereaallikko
Helper III
Helper III

Problems with columns

Hi all, 


I am having difficulties with columns containing tags. An example:


Having a table containing the work, timing and place as hashtags and assignee, like this


TaskHashtagsAssignee
Plan the furniture#middle,#Week1-2Jack
Design the structure#up,#down,#Week1-2John
Design the connections#Week1-2,#up,#down,#Week3-4Lewis
Test the connections#down,#Week3-4Lewis
Prepare the equipment#middle,#down,#upJamie
Fix the radiator#up,#Week1-2,#Week3-4John
Cover the floor#down,#middle,#Week3-4,#Week5-6Jack
Clear the workspace#down,#up,#middleJack
Set up the room#middle,#up,#Week5-6John


How can I set the columns in a way, that each of the hashtags applies separately for example to the task. 

Now my Power BI sets the hashtags according to the column. 
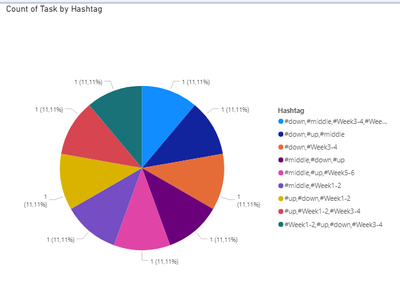


Untitled3.png So for instance, here I would like the legend to show hashtags individually, as 

#down

#middle

#up

#Week1-2

#Week3-4

#Week5-6


I already tried to solve it with Conditional column, with setting rules [hashtag],"contains", and then applying the specific value.

But each task applies only to one hashtag according to the set hierarchy. 


Difficult to explain the situation, but hopefully somebody understood it and can help me out.


Thanks,


Jere

1 ACCEPTED SOLUTION

Hi @jereaallikko 


Please see the attached file with a solution, all steps are done using UI so it should be fairly easy to replicate, but if you struggle let me know.


Best Regards,
Mariusz

If this post helps, then please consider Accepting it as the solution.

Please feel free to connect with me.
LinkedIn


View solution in original post

4 REPLIES 4
Mariusz
Community Champion
Community Champion

Hi @jereaallikko 


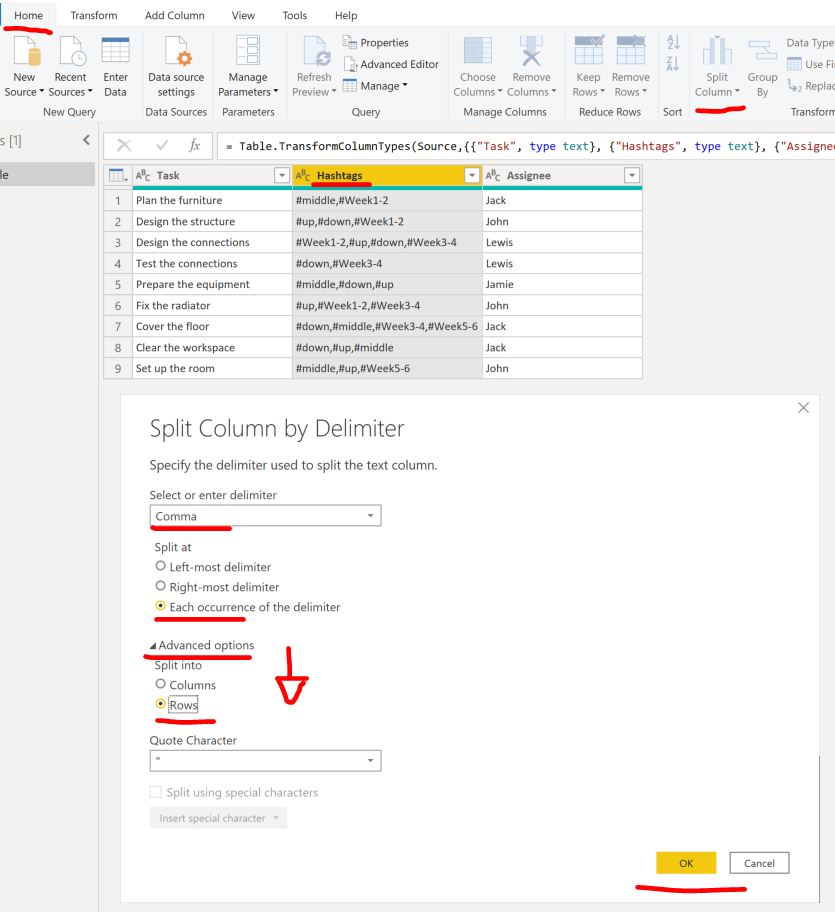
You can split the Hashtags column by Delimiter as below.


image.png

This will result in a table like below.


image.png

Best Regards,
Mariusz

If this post helps, then please consider Accepting it as the solution.

Please feel free to connect with me.
LinkedIn


Hi @Mariusz 


Thanks for the reply. It helped me a bit with my problem.

However, I ran into new problems with slicers. 


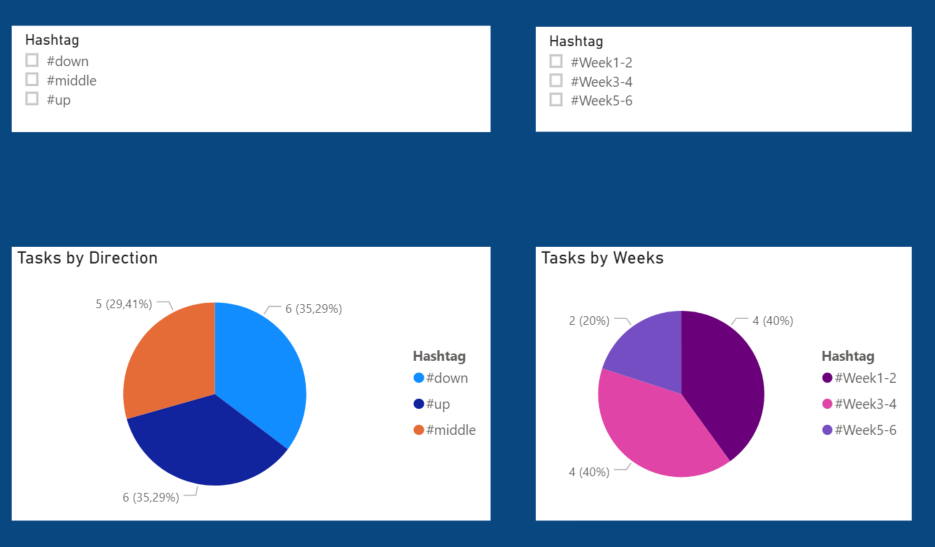
An example: I have two pie charts and two set of slicers based on weeks and the direction. I filtered the charts to show Weeks and Directions of Tasks separately.


Untitled.png


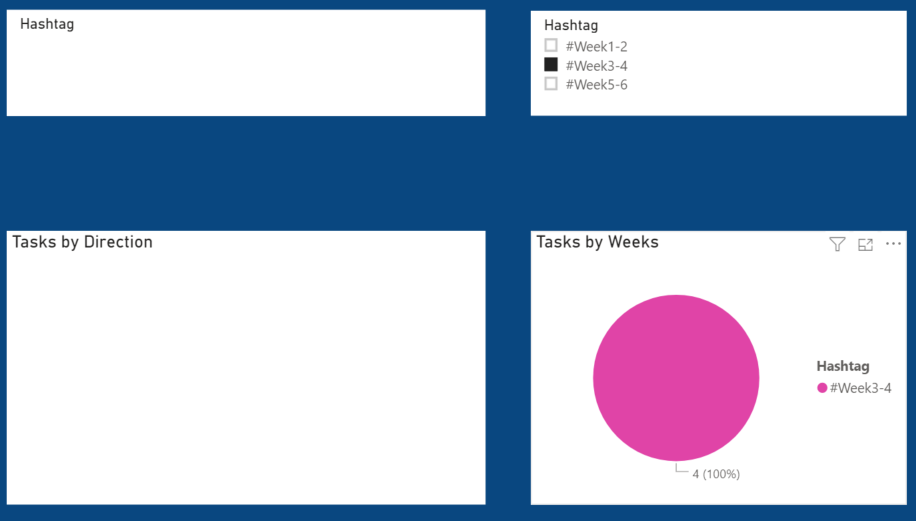
The problem occurs when I want use either of the slicers. The other chart turns blank. 


Untitled2.png


So here, I used the slicer of Week3-4, and the Direction chart is blank. What I'm hoping to see, is the direction pie chart change accordingly as well. In this situation, the Direction chart should show all three directions (#middle, 2x#up, 2x#down)


Any tips?


Best Regards


Jere

Hi @jereaallikko 


Please see the attached file with a solution, all steps are done using UI so it should be fairly easy to replicate, but if you struggle let me know.


Best Regards,
Mariusz

If this post helps, then please consider Accepting it as the solution.

Please feel free to connect with me.
LinkedIn


Hi @Mariusz 


Got the problem solved. Thanks a lot Mariusz!


Best Regards

Jere

Helpful resources

Announcements
FabCon and SQLCon Barcelona 2026

FabCon & SQLCon – Barcelona 2026

Join us in Barcelona for FabCon and SQLCon, the Fabric, Power BI, SQL, and AI community event. Save €200 with code FABCMTY200.

60 days of Data Days Carousel

Data Days 2026

Join Data Days 2026: 60 days of free live/on-demand sessions, challenges, study groups, and certification opportunities.

Power BI DataViz World Championships carousel

Power BI DataViz World Championships - June 2026

A new Power BI DataViz World Championship is coming this June! Don't miss out on submitting your entry.