Get certified for free when you join Fabric Data Days 2026 and dive into Fabric, Power BI, SQL, AI, and other essential data skills.
Join nowJuly 7 - July 17 | Round 2 of the Power BI Dataviz World Championships. Don't miss your chance! Learn more
Hi I have a table as follows
| CustID | GroupID | CustType | Amount | Group_CustType_Concat |
| 1 | 1 | Intermediate | 10 | 1Intermediate |
| 1 | 1 | Intermediate | 20 | 1Intermediate |
| 2 | 3 | Regular | 30 | 3Regular |
| 2 | 3 | Regular | 40 | 3Regular |
| 2 | 3 | Regular | 30 | 3Regular |
| 3 | 2 | Intermediate | 20 | 2Intermediate |
| 3 | 2 | Intermediate | 60 | 2Intermediate |
| 4 | 4 | Rare | 40 | 4Rare |
| 5 | 1 | Rare | 30 | 1Rare |
I have concatinated GroupID and CustType to form unique combination.
I have then created what-if parameters for each CustType grouped by Group IDs as seen below.
The goal is to sum 'Amount' for each unique value in Group_CustType_Concat and then multiply it by the respective what-if parameter value. In the current Dax I am creating measures for each unique concatination to calculate the sum of amount and then multiply it by the respective parameter value. Another measure is created to add the results of the measures and group them by CustType to form a line chart.
1Intermediate= Calculate(sum('Table'[amount]),'Table'[Group_CustType_Concat]=="1Intermediate") * '1Intermediate'[1Intermediate Value]
This is repeated for all unique Group_CustType_Concat and then added together using switch statement based on each custType.
However, this is a very inefficient way, as there can be multiple Groups and CustTypes leading to a large number of combinations. Is there a more efficient way of doing this, so I don't have to hardcode Dax for each Group_CustType_Concat? Maybe some kind of loop that itterates through each Group_CustType_Concat and automatically calculates the sum and multiplies it by it's respective parameter? Maybe power query loop?
Solved! Go to Solution.
Hi @Anonymous
You can try this measure. But the section in SWITCH function is still hard coding.
Result =
VAR _table =
SUMMARIZE (
'Table',
'Table'[GroupID],
'Table'[CustType],
'Table'[Group_CustType_Concat],
"Sum_Of_Amount", SUM ( 'Table'[Amount] )
)
VAR _table2 =
ADDCOLUMNS (
_table,
"Amount*Parameter",
[Sum_Of_Amount]
* SWITCH (
[Group_CustType_Concat],
"1Intermediate", [Intermediate G1 Value],
"2Intermediate", [Intermediate G2 Value],
"1Regular", [Regular G1 Value],
"2Regular", [Regular G2 Value],
"1Rare", [Rare G1 Value],
"2Rare", [Rare G2 Value]
)
)
RETURN
SUMX ( _table2, [Amount*Parameter] )
I use a table visual in my sample. For a line chart, you can put CustType on Axis or Legend to check the result.
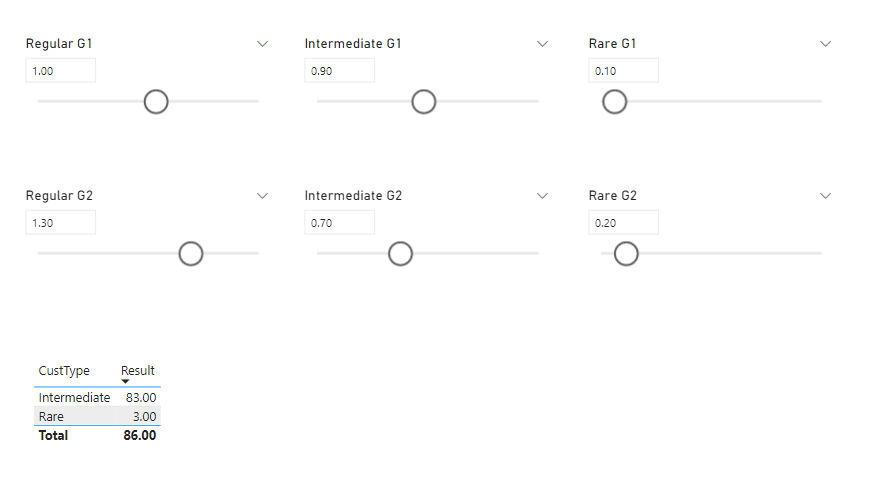
Best Regards,
Community Support Team _ Jing
If this post helps, please Accept it as Solution to help other members find it.
Hi @Anonymous
You can try this measure. But the section in SWITCH function is still hard coding.
Result =
VAR _table =
SUMMARIZE (
'Table',
'Table'[GroupID],
'Table'[CustType],
'Table'[Group_CustType_Concat],
"Sum_Of_Amount", SUM ( 'Table'[Amount] )
)
VAR _table2 =
ADDCOLUMNS (
_table,
"Amount*Parameter",
[Sum_Of_Amount]
* SWITCH (
[Group_CustType_Concat],
"1Intermediate", [Intermediate G1 Value],
"2Intermediate", [Intermediate G2 Value],
"1Regular", [Regular G1 Value],
"2Regular", [Regular G2 Value],
"1Rare", [Rare G1 Value],
"2Rare", [Rare G2 Value]
)
)
RETURN
SUMX ( _table2, [Amount*Parameter] )
I use a table visual in my sample. For a line chart, you can put CustType on Axis or Legend to check the result.
Best Regards,
Community Support Team _ Jing
If this post helps, please Accept it as Solution to help other members find it.
Join us in Barcelona for FabCon and SQLCon, the Fabric, Power BI, SQL, and AI community event. Save €200 with code FABCMTY200.
Join Fabric Data Days 2026: 60 days of free live/on-demand sessions, challenges, study groups, and certification opportunities.
| User | Count |
|---|---|
| 8 | |
| 5 | |
| 5 | |
| 4 | |
| 4 |