This is best Fabric, Power BI, SQL and AI community event. How do we know? The last event sold out! Save €200 with code FABCMTY200.
Register nowThe Fabric community is upgrading! Read all of the details including the timeline and what you can expect. Learn more
I have created about 40 measures in PBI but need them to display on rows. I have found I need to either do the calculations in the database query or via Power Query. I prefer Power Query for the self management (speed of changes).
I have not been able to find anything on filtering using multiple values for multiple fields.
This is the DAX Measure formula. How would it be written in Power Query "M"?
Solved! Go to Solution.
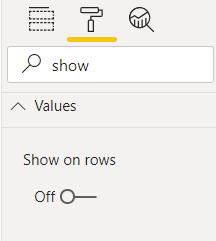
FYI that the matrix visual has a format option called "Show On Rows" that may simplify things. If that doesn't work, please describe your scenario further, to confirm that you need to transform your data. You should not need to do calculations like this in your query (DAX is the way to go).
Pat
To learn more about Power BI, follow me on Twitter or subscribe on YouTube.
DOHH!.😲
Thanks Pat. I was using the Matrix visual and completley skipped the option.
This is easily done via the GUI filtering dialogue. Just click on the drop down at the top of the column, select the filter options, then advanced. You can change those drop downs from value to column, and change "and" to "or" and chain your filters together pretty easily.
--Nate
FYI that the matrix visual has a format option called "Show On Rows" that may simplify things. If that doesn't work, please describe your scenario further, to confirm that you need to transform your data. You should not need to do calculations like this in your query (DAX is the way to go).
Pat
To learn more about Power BI, follow me on Twitter or subscribe on YouTube.
Join us in Barcelona for FabCon and SQLCon, the Fabric, Power BI, SQL, and AI community event. Save €200 with code FABCMTY200.