Get certified for free when you join Fabric Data Days 2026 and dive into Fabric, Power BI, SQL, AI, and other essential data skills.
Join nowJuly 7 - July 17 | Round 2 of the Power BI Dataviz World Championships. Don't miss your chance! Learn more
Hello,
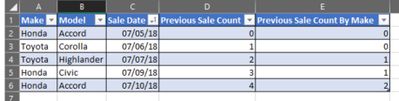
could someone help me? I'm trying to built a column in power query to count how many times have I made a sale and, most importantly, what sale (order by brand and date) was that. The image shows that the column "Previous Sale Count by Make" is what I'm having trouble with.
Solved! Go to Solution.
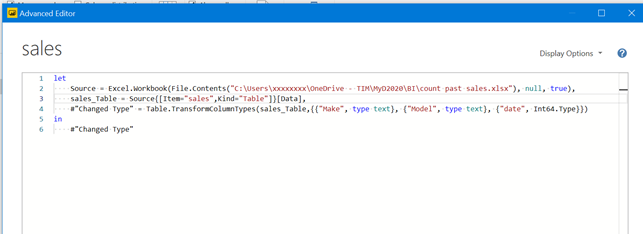
you mjust load you data and goes unde view/advance editors panel in PBI (I understood you use PBI, is it true?).
inside this panel cut and paste the lines of code you find in my post.
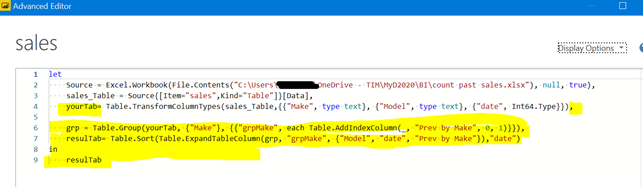
edit and modify so that you have a situation like this:
that is all.
a guess for the "hard" part only 😁
you have to add these lines after your lasta step and adapt the name of yourTab and other parameter as you like:
grp = Table.Group(yourTab, {"Make"}, {{"grpMake", each Table.AddIndexColumn(_, "Prev by Make", 0, 1)}}),
resulTab= Table.Sort(Table.ExpandTableColumn(grp, "grpMake", {"Model", "date", "Prev by Make"}),"date")
in
resulTab
Thanks for replying @Anonymous ,
unfortunately, I couldn't quite understand how to implement it, I believe I'm not that advanced in PBI yet. Could you please explain step-by-step how to implement it a little bit more, please?
you mjust load you data and goes unde view/advance editors panel in PBI (I understood you use PBI, is it true?).
inside this panel cut and paste the lines of code you find in my post.
edit and modify so that you have a situation like this:
that is all.
Thanks @Anonymous !
Join us in Barcelona for FabCon and SQLCon, the Fabric, Power BI, SQL, and AI community event. Save €200 with code FABCMTY200.
Join Data Days 2026: 60 days of free live/on-demand sessions, challenges, study groups, and certification opportunities.