Fabric Data Days starts November 4th!
Advance your Data & AI career with 50 days of live learning, dataviz contests, hands-on challenges, study groups & certifications and more!
Get registered- Power BI forums
- Get Help with Power BI
- Desktop
- Service
- Report Server
- Power Query
- Mobile Apps
- Developer
- DAX Commands and Tips
- Custom Visuals Development Discussion
- Health and Life Sciences
- Power BI Spanish forums
- Translated Spanish Desktop
- Training and Consulting
- Instructor Led Training
- Dashboard in a Day for Women, by Women
- Galleries
- Data Stories Gallery
- Themes Gallery
- Contests Gallery
- QuickViz Gallery
- Quick Measures Gallery
- Visual Calculations Gallery
- Notebook Gallery
- Translytical Task Flow Gallery
- TMDL Gallery
- R Script Showcase
- Webinars and Video Gallery
- Ideas
- Custom Visuals Ideas (read-only)
- Issues
- Issues
- Events
- Upcoming Events
Get Fabric Certified for FREE during Fabric Data Days. Don't miss your chance! Request now
- Power BI forums
- Forums
- Get Help with Power BI
- Power Query
- Calculate cumulative each month shown multiple tim...
- Subscribe to RSS Feed
- Mark Topic as New
- Mark Topic as Read
- Float this Topic for Current User
- Bookmark
- Subscribe
- Printer Friendly Page
- Mark as New
- Bookmark
- Subscribe
- Mute
- Subscribe to RSS Feed
- Permalink
- Report Inappropriate Content
Calculate cumulative each month shown multiple times
Hi everyone,
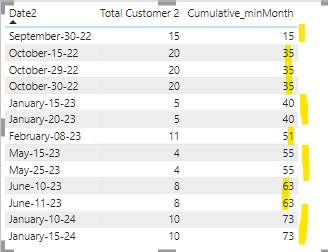
This is the original dataset I have, I want to calculate cumulative total customer each month
Expected Result:
Total customer in column "Total Customer 2" is already total of that month. Cumulative values should be sum of previous month + this month.
Thanks in advance!
- Mark as New
- Bookmark
- Subscribe
- Mute
- Subscribe to RSS Feed
- Permalink
- Report Inappropriate Content
You can calculate running total also in Power Query:
let
    Source = Table.FromRows(Json.Document(Binary.Decompress(Binary.FromText("dc/RDYAgDATQXfgm4a4CyizG/dewaCAt0c/mtdf2PAMBhhg2JLQkENGCJVxxEksiJsGSNENuSPN+ROPALltvc2kwIlZwJMgQco0rk1ycFbdIL0MdUp3QiKwzz3FZi/3zofzuuW4=", BinaryEncoding.Base64), Compression.Deflate)), let _t = ((type nullable text) meta [Serialized.Text = true]) in type table [#"Customer No" = _t, Date = _t, #"Customer Sales" = _t]),
    ChangedType = Table.TransformColumnTypes(Source,{{"Customer No", Int64.Type}, {"Date", type date}, {"Customer Sales", Int64.Type}}, "sk-SK"),
    Ad_YearMonth = Table.AddColumn(ChangedType, "Year Month", each Date.ToText([Date],"yyyy-MM"), type text),
    GroupedRowsCustomerYearMonth = Table.Group(Ad_YearMonth, {"Customer No", "Year Month"}, {{"All", each Table.Sort(_, {"Date"}), type table}}),
    //Running Total Function - in use 3 times below
    fn_runningTotal =
        (colName as text, all as table, sales as list)=>
        [
            cs = List.Buffer(sales),
            lg =
                List.Generate(
                    ()=> [x = 0, rt = cs{0}],
                    each [x] < List.Count(cs),
                    each [x = [x]+1, rt = [rt] + cs{x}],
                    each [rt]
                ),
            merge = Table.FromColumns(Table.ToColumns(all) & {lg}, Table.ColumnNames(all) & {colName})
        ][merge],
    //fn_runningTotal 1st use
    Ad_RTMonthly = Table.AddColumn(GroupedRowsCustomerYearMonth, "RT", each fn_runningTotal("RT Monthly", [All], [All][Customer Sales]), type table),
    RemovedOtherColumns1 = Table.SelectColumns(Ad_RTMonthly,{"RT"}),
    ExpandedRTMonthly = Table.ExpandTableColumn(RemovedOtherColumns1, "RT", Table.ColumnNames(ChangedType) & {"RT Monthly"}, Table.ColumnNames(ChangedType) & {"RT Monthly"}),
    Ad_Year = Table.AddColumn(ExpandedRTMonthly, "Year", each Date.Year([Date]), Int64.Type),
    GroupedRowsCustomerYear = Table.Group(Ad_Year, {"Customer No", "Year"}, {{"All", each _, type table}}),
    //fn_runningTotal 2nd use
    Ad_RTYearly = Table.AddColumn(GroupedRowsCustomerYear, "RT", each fn_runningTotal("RT Yearly", [All], [All][Customer Sales]), type table),
    RemovedOtherColumns2 = Table.SelectColumns(Ad_RTYearly,{"RT"}),
    ExpandedRTYearly = Table.ExpandTableColumn(RemovedOtherColumns2, "RT", Table.ColumnNames(ExpandedRTMonthly) & {"RT Yearly"}, Table.ColumnNames(ExpandedRTMonthly) & {"RT Yearly"}),
    GroupedRowsCustomer = Table.Group(ExpandedRTYearly, {"Customer No"}, {{"All", each _, type table}}),
    //fn_runningTotal 3rd use
    Ad_RTCustomer = Table.AddColumn(GroupedRowsCustomer, "RT", each fn_runningTotal("RT Customer", [All], [All][Customer Sales]), type table),
    RemovedOtherColumns3 = Table.SelectColumns(Ad_RTCustomer,{"RT"}),
    ExpandedRTCustomer = Table.ExpandTableColumn(RemovedOtherColumns3, "RT", Table.ColumnNames(ExpandedRTYearly) & {"RT Customer"}, Table.ColumnNames(ExpandedRTYearly) & {"RT Customer"})
in
ExpandedRTCustomer- Mark as New
- Bookmark
- Subscribe
- Mute
- Subscribe to RSS Feed
- Permalink
- Report Inappropriate Content
Try this measure:
Cum_MinMonth_Values =
var _mxDt = SELECTEDVALUE(Table1[Date2])
var _t1 = FILTER( ALL('Table1'), 'Table1'[Date2] <= _mxDt)
Return  sumx ( SUMMARIZE( _t1, Table1[Date2].[Year], Table1[Date2].[MonthNo], "_sv", Min(Table1[Total Customer 2])), [_sv])
OP:
- Mark as New
- Bookmark
- Subscribe
- Mute
- Subscribe to RSS Feed
- Permalink
- Report Inappropriate Content
FYI, You did not ask all three measures, I did for my own check:
RT MinMonth_Values =
var _mxDt = SELECTEDVALUE(Table1[Date2])
var _t1 = FILTER( ALL('Table1'), 'Table1'[Date2] <= _mxDt)
Return  sumx ( SUMMARIZE( _t1, Table1[Date2].[Year], Table1[Date2].[MonthNo], "_sv", Min(Table1[Total Customer 2])), [_sv])

RT for each month = CALCULATE( SUM('Table1'[Total Customer 2]), DATESMTD( Table1[Date2] ) )

RT (all values) =
var _mxDt = SELECTEDVALUE(Table1[Date2])
RETURN CALCULATE( SUM('Table1'[Total Customer 2]), FILTER( ALL('Table1'), 'Table1'[Date2] <= _mxDt) )
OP:
Helpful resources

Fabric Data Days
Advance your Data & AI career with 50 days of live learning, contests, hands-on challenges, study groups & certifications and more!

Power BI Monthly Update - October 2025
Check out the October 2025 Power BI update to learn about new features.


