cancel
Showing results for 
Search instead for 
Did you mean: 

July 7 - July 17 | Round 2 of the Power BI Dataviz World Championships. Don't miss your chance! Learn more

Reply
Anonymous
Not applicable

Visualizing (Bar chart) two data points using two 2 date columns from the same table.

Hello,


Can you help me here?


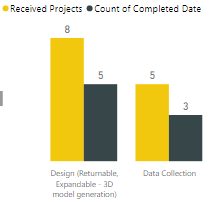
I have 2 date columns (in the same table) and want to visualize 2 data fields as a Bar chart (side by side). see below screenshots.


Submision Date - Data field : Recieved projects

Completed Dates - Data Field: Delivered Projects


Shree185_0-1627167756882.png


Thank you!


3 REPLIES 3
V-lianl-msft
Community Support
Community Support

According to my test, this cannot be done. There cannot be multiple fields on the X axis. It is recommended that you create two charts and overlap them.

Fowmy
Super User
Super User

@Anonymous 

Can you share the sample or dummy data for this chart?


Did I answer your question? Mark my post as a solution! and hit thumbs up


Subscribe and learn Power BI from these videos

Website LinkedIn PBI User Group

Anonymous
Not applicable

@Fowmy 


Provided data for this. I want to show barchart to show to count of Data values using two diffrent date columns.  I want use month filter to show month wise data. Please let me know if you have any questions for me.


Thank you!


Data ValuesReceived ProjectsCount of Completed DateCompleted DateSubmission Date
Data Collection227/2/2021 0:006/30/2021 0:00
2D Creation (Fully Detailed Print Drawings)116/25/2021 0:006/22/2021 0:00
Container Stuffing Validation (Cargo Wiz, Pack Assistant, Creo)117/5/2021 0:006/11/2021 0:00
Data Collection1  6/8/2021 0:00
Data Collection1  6/23/2021 0:00
Data Collection117/29/2021 0:006/23/2021 0:00
Design (Returnable, Expandable - 3D model generation)1  6/10/2021 0:00
Design (Returnable, Expandable - 3D model generation)1  6/11/2021 0:00
Design (Returnable, Expandable - 3D model generation)1  6/29/2021 0:00
Design (Returnable, Expandable - 3D model generation)116/7/2021 0:006/1/2021 0:00
Design (Returnable, Expandable - 3D model generation)116/16/2021 0:006/8/2021 0:00
Design (Returnable, Expandable - 3D model generation)116/24/2021 0:006/11/2021 0:00
Design (Returnable, Expandable - 3D model generation)116/25/2021 0:006/8/2021 0:00
Design (Returnable, Expandable - 3D model generation)117/6/2021 0:006/11/2021 0:00
MPN Setup1  6/30/2021 0:00
Others116/25/2021 0:006/7/2021 0:00
Others116/26/2021 0:006/7/2021 0:00
Others117/6/2021 0:006/1/2021 0:00
Others117/7/2021 0:006/8/2021 0:00
Packaging Solution (Multiple activities - Data Collection, Concept, FEA, Print Drawings,  SWES Creation, etc)116/11/2021 0:006/1/2021 0:00
Packaging Solution (Multiple activities - Data Collection, Concept, FEA, Print Drawings,  SWES Creation, etc)116/14/2021 0:006/4/2021 0:00
Packaging Work Order (Define, Collect, Validate, Update and Upload)1  6/18/2021 0:00

Helpful resources

Announcements
FabCon and SQLCon Barcelona 2026

FabCon & SQLCon – Barcelona 2026

Join us in Barcelona for FabCon and SQLCon, the Fabric, Power BI, SQL, and AI community event. Save €200 with code FABCMTY200.

July Power BI Update Carousel

Power BI Monthly Update - July 2026

Check out the July 2026 Power BI update to learn about new features.

60 days of Data Days Carousel

Data Days 2026

Join Data Days 2026: 60 days of free live/on-demand sessions, challenges, study groups, and certification opportunities.

Power BI DataViz World Championships carousel

Power BI DataViz World Championships - June 2026

A new Power BI DataViz World Championship is coming this June! Don't miss out on submitting your entry.