cancel
Showing results for 
Search instead for 
Did you mean: 

July 7 - July 17 | Round 2 of the Power BI Dataviz World Championships. Don't miss your chance! Learn more

Reply
shb
Frequent Visitor

TopN DateTime column values

Hi,


I have a dataset with DateTime and Reading (int) columns. I want to show the readings over the time axis as a line graph but only for last 50 datetime values as the data is too large to show in the line graph and the user is only interested to see last 50 values. I am not sure if I can use the RANKX function as follows? This does not work as it ask to provide some aggregate function around datetime field that I am not sure which one should it be. 


Rank = RANKX(ALL(DatasetName), DatasetName[Datetime])  


Could you please suggest any alternative to achieve the above?

2 REPLIES 2
Eric_Zhang
Microsoft Employee
Microsoft Employee

@shb


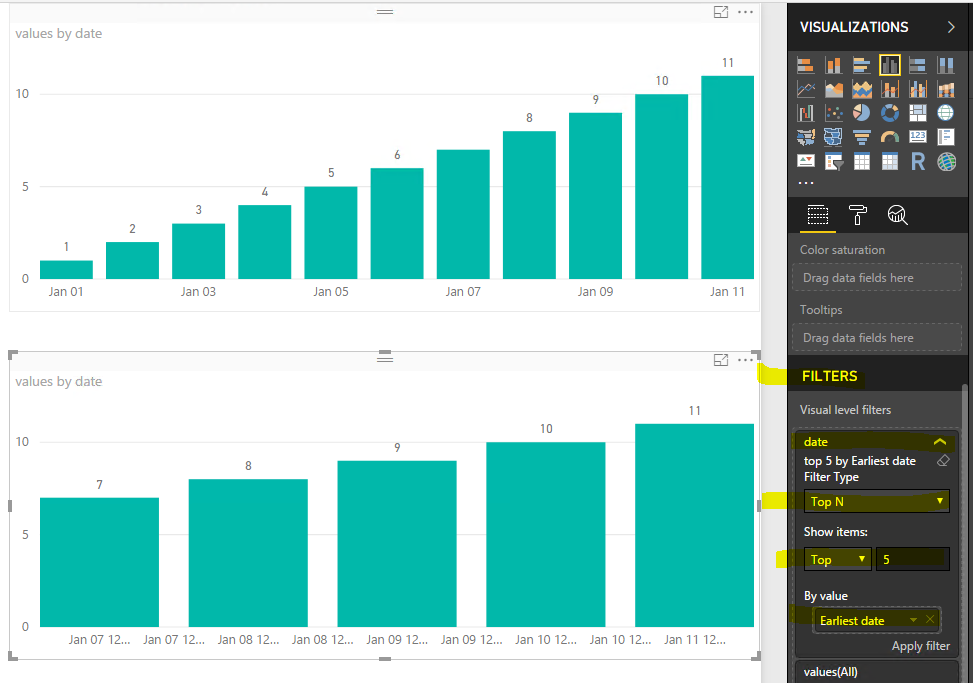
You can set TOPN filter, see attached sample.

Capture.PNG

Thanks @Eric_Zhang For some reason this filter was not working on the real-time streaming dataset (on datetime field), it doesn't return anything. But for static dataset the filter does work fine. Do you know why it wouldn't work on the streaming data? Thanks

Helpful resources

Announcements
FabCon and SQLCon Barcelona 2026

FabCon & SQLCon – Barcelona 2026

Join us in Barcelona for FabCon and SQLCon, the Fabric, Power BI, SQL, and AI community event. Save €200 with code FABCMTY200.

60 days of Data Days Carousel

Data Days 2026

Join Data Days 2026: 60 days of free live/on-demand sessions, challenges, study groups, and certification opportunities.

Power BI DataViz World Championships carousel

Power BI DataViz World Championships - June 2026

A new Power BI DataViz World Championship is coming this June! Don't miss out on submitting your entry.