cancel
Showing results for 
Search instead for 
Did you mean: 

July 7 - July 17 | Round 2 of the Power BI Dataviz World Championships. Don't miss your chance! Learn more

Reply
vlengure
Frequent Visitor

Incorrect representation of Bar Graph using R Code in Power BI

Hello Everyone,

This issue is related to replication of a graph/pattern in Power BI using R code.

This is our Dataset -
A,B,C
0,0,1
0,1,0
0,1,1
1,0,0
1,1,0
1,1,0
1,1,1
1,1,1


Rcode :
data <- fread('C:/Users/kkuncham/Downloads/test_upset.txt', sep=',')
 
require('UpSetR','C:/Users/kkuncham/Library')
library(UpSetR)

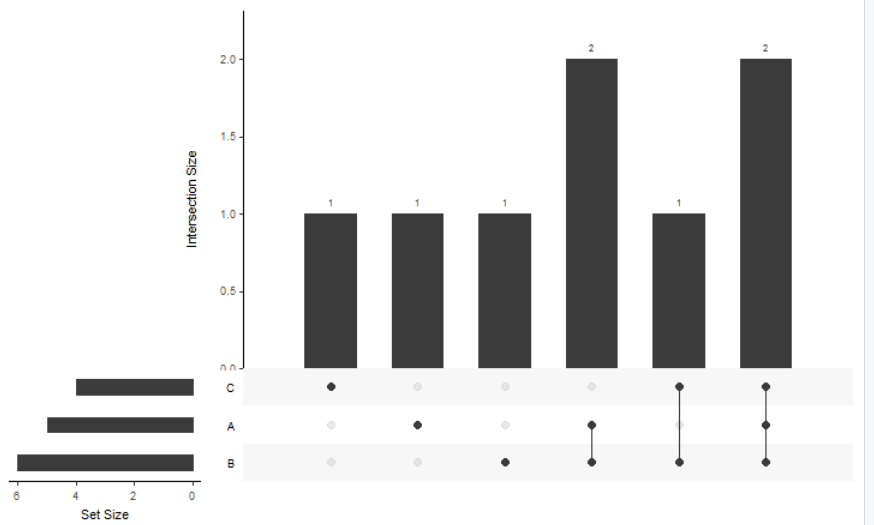
This is the graph in R -

graph in R.png
 

When I try to replicate the below-mentioned code in  Power BI-
 
require('data.table','C:/Users/kkuncham/Library')
library(data.table)
data = as.data.table(dataset)
require('UpSetR','C:/Users/kkuncham/Library')
library(UpSetR)
upset(data )

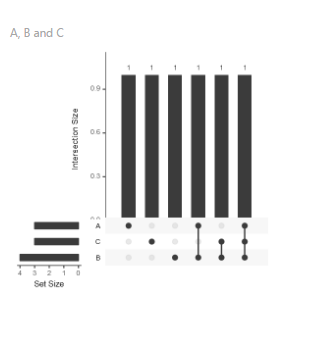
I see this graph, "Bar Graphs" are incorrectly plotted -

graph in Power BI.png
I would really appreciate if anyone can help me with this. Thanks.

Best Regards,
Vivek L
1 ACCEPTED SOLUTION

Hey Michael,

Apologies for the detail. I was able to solve the problem by addressing the removal of the duplicates issue. I created an extra measure to fix it.

Thanks for your attention and time. I really appreciate it.

Best Regards,
Vivek L

View solution in original post

2 REPLIES 2
v-micsh-msft
Microsoft Employee
Microsoft Employee

Would you please share the Library file for further investigation?


The file should be stored in:

C:/Users/kkuncham/Library


I suspect the display error might be caused by the Library execution.


Regards,

Michael


Hey Michael,

Apologies for the detail. I was able to solve the problem by addressing the removal of the duplicates issue. I created an extra measure to fix it.

Thanks for your attention and time. I really appreciate it.

Best Regards,
Vivek L

Helpful resources

Announcements
FabCon and SQLCon Barcelona 2026

FabCon & SQLCon – Barcelona 2026

Join us in Barcelona for FabCon and SQLCon, the Fabric, Power BI, SQL, and AI community event. Save €200 with code FABCMTY200.

60 days of Data Days Carousel

Data Days 2026

Join Fabric Data Days 2026: 60 days of free live/on-demand sessions, challenges, study groups, and certification opportunities.

Power BI DataViz World Championships carousel

Power BI DataViz World Championships - June 2026

A new Power BI DataViz World Championship is coming this June! Don't miss out on submitting your entry.