cancel
Showing results for 
Search instead for 
Did you mean: 

Learn from the best! Meet the four finalists headed to the FINALS of the Power BI Dataviz World Championships! Register now

Reply
FunDeckHermit
Helper I
Helper I

How to define dataViewMapping with two different tables?

Hello everyone,

I'm trying to create a custom visual based on D3's Visavail, the linked example defines two datasets: catagories and data:

var dataset = [{
    "measure": "Fat Bike",
    "categories": { // category names and their colors defined here
        "Kim": { "color": "#377eb8" },
        "Bert": { "color": "#ff7f00" },
        "Zoe": { "color": "purple" },
        },
    "data": [
        ["2016-01-01 12:00:00", "Kim", "2016-01-01 13:00:00"],
        ["2016-01-01 14:22:51", "Zoe", "2016-01-01 16:14:12"],
        ["2016-01-01 16:14:12", "Bert", "2016-01-01 17:14:12"],
        ["2016-01-01 19:20:05", "Zoe", "2016-01-01 20:30:00"]
    ]
}];

Question:

how do I define two different tables in my dataViewMappings, one for the categories and one for the data?
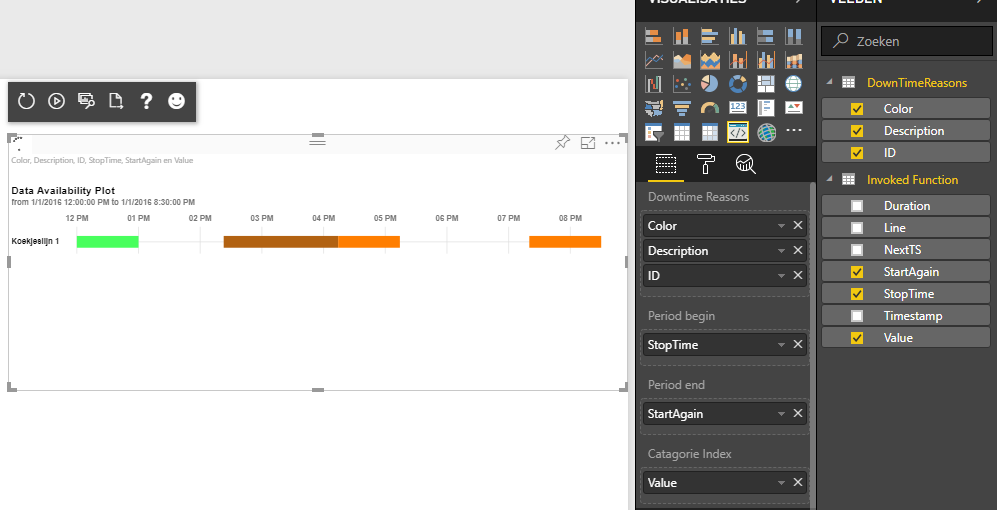
 

Dataroles:

Here is a screenshot of my data, the chart is succesfully created with pre-defined data.


DataViewMapping:

Why is the datamapping below not creating two tables?

    "dataViewMappings": [
        {
	    "conditions":[
	     {
		"DownTimes":{
		     "max": 3
		}			
	     }
	     ],
            "table": {
                "rows": {
                    "for": {  "in": "DownTimes"  }
                }
            }
        },
        {
            "conditions":[
                {
                    "Begin":{
                        "max": 1
                    },					
                    "End":{
                        "max": 1
                    },
                    "RedenIndex":{
                        "max": 1
                    }
                }
            ],
            "table": {
                "rows": {
                    "select":[
                        {"for": {  "in": "Begin"  }},
                        {"for": {  "in": "End"  }},
                        {"for": {  "in": "RedenIndex"  }}
                    ]
                }
            }
        }			
    ]


I included the total project folder: Here (zip)

1 ACCEPTED SOLUTION
v-viig
Community Champion
Community Champion

Power BI Custom Visuals API does not support multi data view mappings.

You should use a single dataViewMapping to get all of data.


Ignat Vilesov,

Software Engineer


Microsoft Power BI Custom Visuals

pbicvsupport@microsoft.com

View solution in original post

1 REPLY 1
v-viig
Community Champion
Community Champion

Power BI Custom Visuals API does not support multi data view mappings.

You should use a single dataViewMapping to get all of data.


Ignat Vilesov,

Software Engineer


Microsoft Power BI Custom Visuals

pbicvsupport@microsoft.com

Helpful resources

Announcements
Power BI DataViz World Championships carousel

Power BI DataViz World Championships - June 2026

A new Power BI DataViz World Championship is coming this June! Don't miss out on submitting your entry.

Join our Fabric User Panel

Join our Fabric User Panel

Share feedback directly with Fabric product managers, participate in targeted research studies and influence the Fabric roadmap.

March Power BI Update Carousel

Power BI Community Update - March 2026

Check out the March 2026 Power BI update to learn about new features.