Hey!
I have been trying to build a custom visual that looks something like this with help of the sampleBarChart visual on Microsoft Github.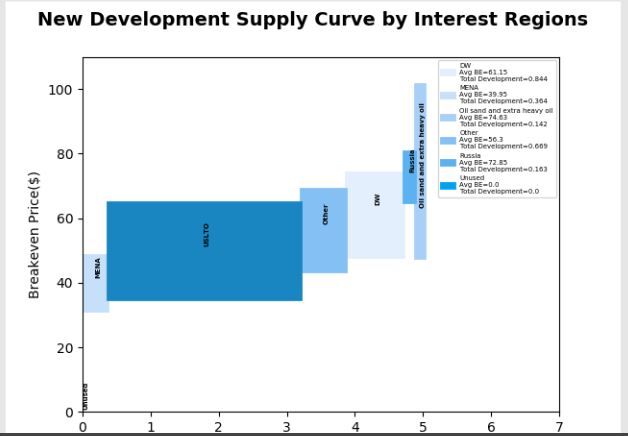
I have loaded my data using the following code.
"dataRoles": [{
            "displayName": "Category Data",
            "name": "category",
            "kind": "Grouping"
        },

        {
            "displayName": "x1",
            "name": "x1",
            "kind": "Measure"
        },
		{
            "displayName": "x2",
            "name": "x2",
            "kind": "Measure"
        },
		{
            "displayName": "y1",
            "name": "y1",
            "kind": "Measure"
        },
		{
            "displayName": "y2",
            "name": "y2",
            "kind": "Measure"
        },
        {
            "displayName": "Tooltips",
            "name": "Tooltips",
            "kind": "Measure"
        }
    ],


"dataViewMappings": [{
        "conditions": [{
            "category": {
                "max": 1
            },
            "x1": {
                "max": 1
            },
			"x2": {
                "max": 1
            },
			"y1": {
                "max": 1
            },
			"y2": {
                "max": 1
            }
        }],

		"categorical": {
            "categories": {
                "for": {
                    "in": "category"
                }
            },
            "values": {
                "select": [{
                    "bind": {
                        "to": "x1"
                    }
                },
					{
                    "bind": {
                        "to": "x2"
                    }
					},
					{
                    "bind": {
                        "to": "y1"
                    }
					},
					{
                    "bind": {
                        "to": "y2"
                    }}
                ]}

            }
        }
    ],
I can view the data on the debug terminal. I am trying to load the data into the code using the following code.
 const dataView = options.dataViews[0];
        let categorical = dataViews[0].categorical;
        let category = categorical.categories[0];
        let datax1 = this.valueForSource(dataView,"x1");
        let datax2 = this.valueForSource(dataView,"x2");
        let datay1 = this.valueForSource(dataView,"y1");
        let datay2 = this.valueForSource(dataView,"y2");
...
barChartDataPoints.push({
                color,
                strokeColor,
                strokeWidth,
                selectionId,
                x1: datax1.values[i],
                x2: datax2.values[i],
                y1: datay1.values[i],
                y2: datay2.values[i],
                category: `${category.values[i]}`

            });
And I edited the rectangle code to look like this.
this.barSelection
                .attr({
                    width: d=> xScale(<number>d.x2-<number>d.x1),
                    height: d => height - yScale(<number>d.y2-<number>d.y1),
                    y: d => <number>d.y2,
                    x: d => <number>d.x1,
                })
                .style({
                    'fill-opacity': opacity,
                    'stroke-opacity': opacity,
                    fill: (dataPoint: BarChartDataPoint) => dataPoint.color,
                    stroke: (dataPoint: BarChartDataPoint) => dataPoint.strokeColor,
                    "stroke-width": (dataPoint: BarChartDataPoint) => `${dataPoint.strokeWidth}px`,
                });
However, the visual is not processing. Please help! @v-viig @Riaon


