Join us in Barcelona for FabCon and SQLCon, September 28 - October 1, 2026.
This is best Fabric, Power BI, SQL and AI community event. How do we know? The last event sold out! Save €200 with code FABCMTY200.
Register now- Power BI forums
- Get Help with Power BI
- Desktop
- Service
- Report Server
- Power Query
- Mobile Apps
- Developer
- DAX Commands and Tips
- Custom Visuals Development Discussion
- Health and Life Sciences
- Power BI Spanish forums
- Translated Spanish Desktop
- Training and Consulting
- Instructor Led Training
- Dashboard in a Day for Women, by Women
- Galleries
- Data Stories Gallery
- Themes Gallery
- Contests Gallery
- QuickViz Gallery
- Quick Measures Gallery
- Visual Calculations Gallery
- Fabric Apps Gallery
- Notebook Gallery
- Translytical Task Flow Gallery
- TMDL Gallery
- R Script Showcase
- Webinars and Video Gallery
- Ideas
- Custom Visuals Ideas (read-only)
- Issues
- Issues
- Events
- Upcoming Events
July 28 - August 9 | Final Round of the Power BI Dataviz World Championships. This is your chance. Learn more
- Power BI forums
- Forums
- Get Help with Power BI
- Desktop
- Re: wrong total sum
- Subscribe to RSS Feed
- Mark Topic as New
- Mark Topic as Read
- Float this Topic for Current User
- Bookmark
- Subscribe
- Printer Friendly Page


- Mark as New
- Bookmark
- Subscribe
- Mute
- Subscribe to RSS Feed
- Permalink
- Report Inappropriate Content
- Mark as New
- Bookmark
- Subscribe
- Mute
- Subscribe to RSS Feed
- Permalink
- Report Inappropriate Content


- Mark as New
- Bookmark
- Subscribe
- Mute
- Subscribe to RSS Feed
- Permalink
- Report Inappropriate Content
If I took the time to answer your question and I came up with a solution, please mark my post as a solution and /or give kudos freely for the effort 🙂 Thank you!
Proud to be a Super User!
- Mark as New
- Bookmark
- Subscribe
- Mute
- Subscribe to RSS Feed
- Permalink
- Report Inappropriate Content
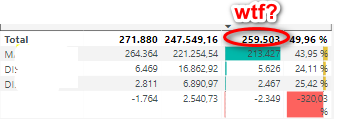
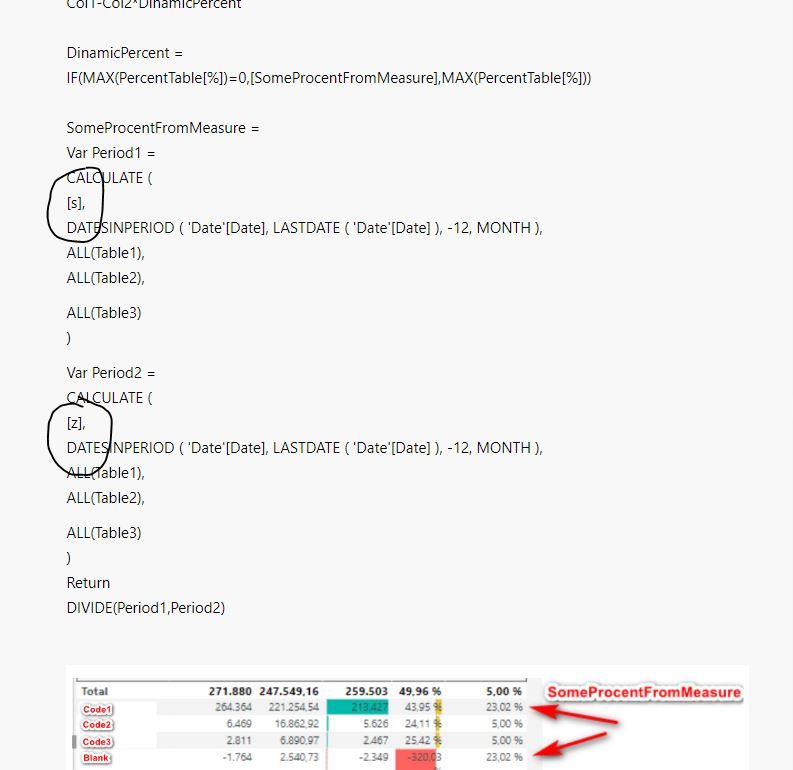
Measure for 4th ( wrong) column
Col1-Col2*DinamicPercent
DinamicPercent =
IF(MAX(PercentTable[%])=0,[SomeProcentFromMeasure],MAX(PercentTable[%]))
SomeProcentFromMeasure =
Var Period1 =
CALCULATE (
[s],
DATESINPERIOD ( 'Date'[Date], LASTDATE ( 'Date'[Date] ), -12, MONTH ),
ALL(Table1),
ALL(Table2),
ALL(Table3)
)
Var Period2 =
CALCULATE (
[z],
DATESINPERIOD ( 'Date'[Date], LASTDATE ( 'Date'[Date] ), -12, MONTH ),
ALL(Table1),
ALL(Table2),
ALL(Table3)
)
Return
DIVIDE(Period1,Period2)

PercentTable
Code | %
Code1 | 0%
Code2 | 5%
Code3 | 5%
- Mark as New
- Bookmark
- Subscribe
- Mute
- Subscribe to RSS Feed
- Permalink
- Report Inappropriate Content
If I took the time to answer your question and I came up with a solution, please mark my post as a solution and /or give kudos freely for the effort 🙂 Thank you!
Proud to be a Super User!
- Mark as New
- Bookmark
- Subscribe
- Mute
- Subscribe to RSS Feed
- Permalink
- Report Inappropriate Content
It is to complex for s and z calculation, so say it Deb - cred from Table10
- Mark as New
- Bookmark
- Subscribe
- Mute
- Subscribe to RSS Feed
- Permalink
- Report Inappropriate Content
If I took the time to answer your question and I came up with a solution, please mark my post as a solution and /or give kudos freely for the effort 🙂 Thank you!
Proud to be a Super User!
- Mark as New
- Bookmark
- Subscribe
- Mute
- Subscribe to RSS Feed
- Permalink
- Report Inappropriate Content
should i post all 100 tables and 200 measures?


- Mark as New
- Bookmark
- Subscribe
- Mute
- Subscribe to RSS Feed
- Permalink
- Report Inappropriate Content
Hi @Analitika ,
It seems to be the issue of measure total, please refer to https://finance-bi.com/power-bi-totals-incorrect/
If this post helps, then please consider Accept it as the solution to help the other members find it more quickly.
Best Regards,
Dedmon Dai
- Mark as New
- Bookmark
- Subscribe
- Mute
- Subscribe to RSS Feed
- Permalink
- Report Inappropriate Content
Solved.
NewMeasure=
SUMX(VALUES(PercentTable[CODE]),[4thcolMeasure])
- Mark as New
- Bookmark
- Subscribe
- Mute
- Subscribe to RSS Feed
- Permalink
- Report Inappropriate Content
i asked you what the calculations are for these measures, its impossible to help you without all the information
If I took the time to answer your question and I came up with a solution, please mark my post as a solution and /or give kudos freely for the effort 🙂 Thank you!
Proud to be a Super User!

Helpful resources

FabCon & SQLCon – Barcelona 2026
Join us in Barcelona for FabCon and SQLCon, the Fabric, Power BI, SQL, and AI community event. Save €200 with code FABCMTY200.

Fabric Community Sticker Challenge - Barcelona 2026
If you love stickers, then you will definitely want to check out our community sticker challenge, Barcelona edition!

Power BI Monthly Update - July 2026
Check out the July 2026 Power BI update to learn about new features.

Power BI DataViz World Championships - June 2026
A new Power BI DataViz World Championship is coming this June! Don't miss out on submitting your entry.

| User | Count |
|---|---|
| 25 | |
| 23 | |
| 19 | |
| 17 | |
| 14 |


| User | Count |
|---|---|
| 24 | |
| 23 | |
| 20 | |
| 20 | |
| 19 |


