cancel
Showing results for 
Search instead for 
Did you mean: 

July 7 - July 17 | Round 2 of the Power BI Dataviz World Championships. Don't miss your chance! Learn more

Reply
klittle95
Regular Visitor

visualization table will only use unique values

I'm fairly new to Power BI, so it's entirely possible the solution to this is staring me in the face, but I've been working on it since yesterday and I'm out of ideas.

I'm trying to calculate how much money an animal hospital is making over time. I have two very simple tables:

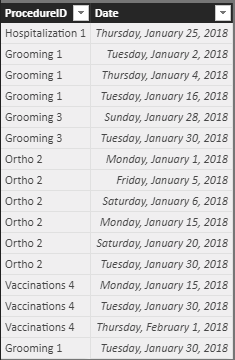
table3.PNGtable4.PNG

As you can see, together they show what procedures were performed over the last month and how much each costs. I have confirmed that they share a relationship based on ProductID:
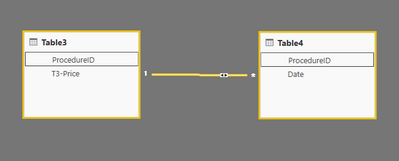
relationship.PNG


All I want is to show how much money they made each month. But when I put the price and date into the same visualization table while making the report, the math is all wrong. I have to leave the day in the table, otherwise some of the rows appear to be duplicates, and the table only counts them once.

Even that doesn't work for the two instances of a procedure costing $15 occurring on January 30th; it only appears once in the table and the math is off accordingly.

I get the closest if I set the Price field to Sum and leave in the days. That way the individual rows are correct. But it totals incorrectly and cannot be used in a line chart. You can see that it seems to think the total is $162, where it should be $732 ($717 in January, $15 in February).

I cannot imagine why using only unique values should be the default. If I go back to the query editor and merge the tables, it works perfectly, but that completely defeats the purpose of having relationships at all.

various tables.PNG

1 ACCEPTED SOLUTION

You were on the right track--the working code:

Working Price = CALCULATE (  SUMX('ProceduresHistory-1', Related(ProceduresDetails[PD-Price])))

View solution in original post

3 REPLIES 3
v-yulgu-msft
Microsoft Employee
Microsoft Employee

Hi @klittle95,


Please try to add below measure into table visual together with date field.

Sum Price =
CALCULATE (
    SUM ( Table1[T3-price] ),
    USERELATIONSHIP ( Table1[ProcedureID], Table2[ProcedureID] )
)


Regards,

Yuliana Gu

Community Support Team _ Yuliana Gu
If this post helps, then please consider Accept it as the solution to help the other members find it more quickly.

Hi @v-yulgu-msft,


I created 

Sum Price = 
CALCULATE (
    SUM ( Table3[T3-price] ),
    USERELATIONSHIP ( Table3[ProcedureID], Table4[ProcedureID] )
)

inside Table3 and added it to each table visual. In every case, it produces the same numbers as Table3[T3-Price] did. 

The same thing happens if I create the measure inside Table4.

You were on the right track--the working code:

Working Price = CALCULATE (  SUMX('ProceduresHistory-1', Related(ProceduresDetails[PD-Price])))

Helpful resources

Announcements
FabCon and SQLCon Barcelona 2026

FabCon & SQLCon – Barcelona 2026

Join us in Barcelona for FabCon and SQLCon, the Fabric, Power BI, SQL, and AI community event. Save €200 with code FABCMTY200.

60 days of Data Days Carousel

Data Days 2026

Join Data Days 2026: 60 days of free live/on-demand sessions, challenges, study groups, and certification opportunities.

Power BI DataViz World Championships carousel

Power BI DataViz World Championships - June 2026

A new Power BI DataViz World Championship is coming this June! Don't miss out on submitting your entry.

Top Solution Authors