
Get certified for free when you join Fabric Data Days 2026 and dive into Fabric, Power BI, SQL, AI, and other essential data skills.
Join nowJuly 7 - July 17 | Round 2 of the Power BI Dataviz World Championships. Don't miss your chance! Learn more
Hi @natanz,
If you don't mind using custom visuals, you can use https://pbivizedit.com service to generate a visual of matching your requirements.
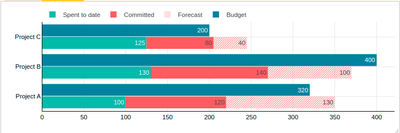
Here is what I am able to produce:
with data:
Having said that, please note that these visuals do not support (at the moment):
1. native tooltips provided by Power BI.
2. Selection on visual.
Thanks,
-R
@natanz , there is a visual, see if that can work for you
https://appsource.microsoft.com/en-us/product/power-bi-visuals/wa200001934?tab=overview
Join us in Barcelona for FabCon and SQLCon, the Fabric, Power BI, SQL, and AI community event. Save €200 with code FABCMTY200.
Join Data Days 2026: 60 days of free live/on-demand sessions, challenges, study groups, and certification opportunities.
| User | Count |
|---|---|
| 29 | |
| 23 | |
| 18 | |
| 18 | |
| 15 |
| User | Count |
|---|---|
| 51 | |
| 44 | |
| 43 | |
| 39 | |
| 32 |