Get certified for free when you join Fabric Data Days 2026 and dive into Fabric, Power BI, SQL, AI, and other essential data skills.
Join nowJuly 7 - July 17 | Round 2 of the Power BI Dataviz World Championships. Don't miss your chance! Learn more
Hi,
Problem: how can I perform segmentation of customers based on the DiffDates (number of days between today and date of the last transaction) with use of ranges defined in a separate and non-conected with the model table. I would like to select for example a "Hot" range on the slicer to filter all my customers who made last transaction within 0-30 days from today.
I have the following input:
Ranges Table (it is not conected with the model)
Ranges[Name] | Ranges[Min Value in Days] | Ranges[Max Value in Days]
Hot | 0 | 30
Warm| 30 | 60
Cold |60 | 180
Frozen |180 | 9999999
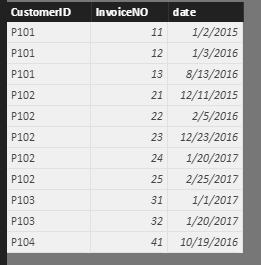
Sales Table
Sales[CustomerId] | Sales[InvoiceNo] | Sales[Date]
Mesures
#LastTransaction = LASTDATE(Sales[Date])
#DiffDates = if(ISBLANK([#LastTransaction]);BLANK();VALUE(TODAY()-[#LastTransaction]))
I have the following tabel report:
Sales[CustomerId] | #LastTransaction | #DiffDates
I need to filter for example only HOT range customers by selecting a range with use of filter/slicer.
Thx a lot for help !
Paweł
Solved! Go to Solution.
Hi @paweldm,
In your scenario, you can create a new table from the Sales table:
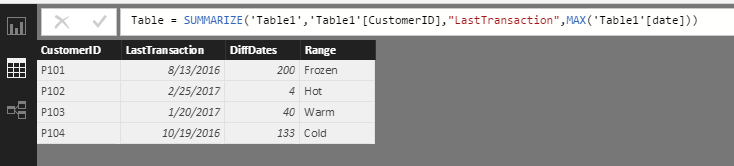
Table = SUMMARIZE('Table1','Table1'[CustomerID],"LastTransaction",MAX('Table1'[date]))
Then create calculated columns in this table:
DiffDates = if(ISBLANK([LastTransaction]),BLANK(),VALUE(TODAY()-[LastTransaction]))
Range = SWITCH(TRUE(),'Table'[DiffDates]>0 && 'Table'[DiffDates]<30,"Hot",'Table'[DiffDates]>30 && 'Table'[DiffDates]<60,"Warm",'Table'[DiffDates]>60 && 'Table'[DiffDates]<180,"Cold",'Table'[DiffDates]>180 && 'Table'[DiffDates]<9999999,"Frozen")
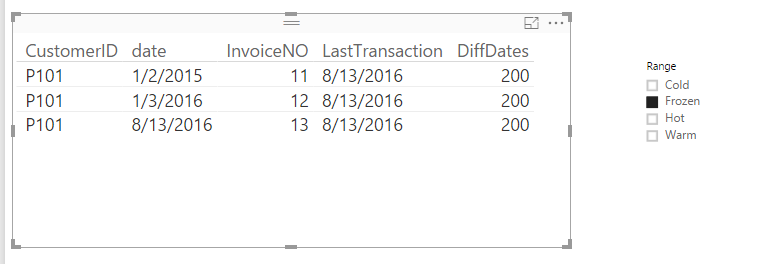
Create a relationship between the Sales table and this new table use CustomerID. Drag Range column from the new table into a slicer visual. For more information, please check attached .pbix.
Best Regards,
Qiuyun Yu
Hi @paweldm,
In your scenario, you can create a new table from the Sales table:
Table = SUMMARIZE('Table1','Table1'[CustomerID],"LastTransaction",MAX('Table1'[date]))
Then create calculated columns in this table:
DiffDates = if(ISBLANK([LastTransaction]),BLANK(),VALUE(TODAY()-[LastTransaction]))
Range = SWITCH(TRUE(),'Table'[DiffDates]>0 && 'Table'[DiffDates]<30,"Hot",'Table'[DiffDates]>30 && 'Table'[DiffDates]<60,"Warm",'Table'[DiffDates]>60 && 'Table'[DiffDates]<180,"Cold",'Table'[DiffDates]>180 && 'Table'[DiffDates]<9999999,"Frozen")
Create a relationship between the Sales table and this new table use CustomerID. Drag Range column from the new table into a slicer visual. For more information, please check attached .pbix.
Best Regards,
Qiuyun Yu
@v-qiuyu-msft wrote:Hi @paweldm,
In your scenario, you can create a new table from the Sales table:
Table = SUMMARIZE('Table1','Table1'[CustomerID],"LastTransaction",MAX('Table1'[date]))
Then create calculated columns in this table:
DiffDates = if(ISBLANK([LastTransaction]),BLANK(),VALUE(TODAY()-[LastTransaction]))
Range = SWITCH(TRUE(),'Table'[DiffDates]>0 && 'Table'[DiffDates]<30,"Hot",'Table'[DiffDates]>30 && 'Table'[DiffDates]<60,"Warm",'Table'[DiffDates]>60 && 'Table'[DiffDates]<180,"Cold",'Table'[DiffDates]>180 && 'Table'[DiffDates]<9999999,"Frozen")
Create a relationship between the Sales table and this new table use CustomerID. Drag Range column from the new table into a slicer visual. For more information, please check attached .pbix.
Best Regards,
Qiuyun Yu
Is there a solution to add to the report one more measure to calculate frequency of invoices?
The frequency is to be calculated as a Customer LifeTime (calculated in days since the first transaction till today) divided by TotalInvoices (calculated as a total number of invoices generated by a customer during its LifeTime)
My current tabel report has the following columns and works exelent with "temperature" slicer:
CustomerID | LastTransaction | DiffDates
Join us in Barcelona for FabCon and SQLCon, the Fabric, Power BI, SQL, and AI community event. Save €200 with code FABCMTY200.
If you love stickers, then you will definitely want to check out our community sticker challenge, Barcelona edition!
Check out the July 2026 Power BI update to learn about new features.
| User | Count |
|---|---|
| 30 | |
| 29 | |
| 25 | |
| 23 | |
| 16 |
| User | Count |
|---|---|
| 45 | |
| 32 | |
| 17 | |
| 16 | |
| 16 |