Get certified for free when you join Fabric Data Days 2026 and dive into Fabric, Power BI, SQL, AI, and other essential data skills.
Join nowJuly 7 - July 17 | Round 2 of the Power BI Dataviz World Championships. Don't miss your chance! Learn more
Hi
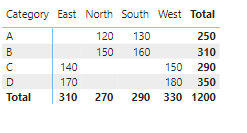
I want to create a matrix chart with period date and region as coulumn header and category as row header ..
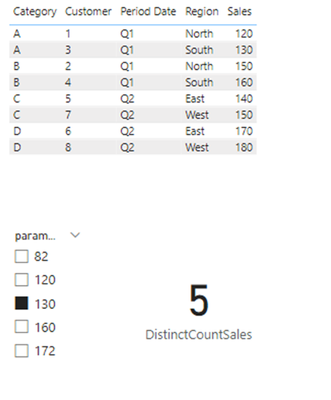
Values - to get the distinct count of the customer who have a order amount greater than a parameter value .
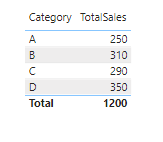
Also have to get the sum of the sales for each catergory .
Please help .
Solved! Go to Solution.
Hi, @mya
Based on your description, I have created some measures to achieve the effect you are looking for. Following picture shows the effect of the display.
Matrix:
Distinct count of the customer:
Total sales by Category:
Measure:
DistinctCountSales =
VAR SelectedValue = SELECTEDVALUE('Parameter'[Parameter])
RETURN
CALCULATE(
DISTINCTCOUNT('Table'[Sales]),
'Table'[Sales] > SelectedValue
)
TotalSales =
SUMX(
SUMMARIZE('Table', 'Table'[Category], "Total Sales", SUM('Table'[Sales])),
[Total Sales]
)
Best Regards,
Yang
Community Support Team
If there is any post helps, then please consider Accept it as the solution to help the other members find it more quickly.
If I misunderstand your needs or you still have problems on it, please feel free to let us know. Thanks a lot!
How to get your questions answered quickly -- How to provide sample data in the Power BI Forum
Hi, @mya
Based on your description, I have created some measures to achieve the effect you are looking for. Following picture shows the effect of the display.
Matrix:
Distinct count of the customer:
Total sales by Category:
Measure:
DistinctCountSales =
VAR SelectedValue = SELECTEDVALUE('Parameter'[Parameter])
RETURN
CALCULATE(
DISTINCTCOUNT('Table'[Sales]),
'Table'[Sales] > SelectedValue
)
TotalSales =
SUMX(
SUMMARIZE('Table', 'Table'[Category], "Total Sales", SUM('Table'[Sales])),
[Total Sales]
)
Best Regards,
Yang
Community Support Team
If there is any post helps, then please consider Accept it as the solution to help the other members find it more quickly.
If I misunderstand your needs or you still have problems on it, please feel free to let us know. Thanks a lot!
How to get your questions answered quickly -- How to provide sample data in the Power BI Forum
Join us in Barcelona for FabCon and SQLCon, the Fabric, Power BI, SQL, and AI community event. Save €200 with code FABCMTY200.
If you love stickers, then you will definitely want to check out our community sticker challenge, Barcelona edition!
Check out the July 2026 Power BI update to learn about new features.
| User | Count |
|---|---|
| 30 | |
| 23 | |
| 23 | |
| 23 | |
| 14 |
| User | Count |
|---|---|
| 48 | |
| 33 | |
| 20 | |
| 18 | |
| 16 |