This time we’re going bigger than ever. Fabric, Power BI, SQL, AI and more. We're covering it all. You won't want to miss it.
Learn moreLevel up your Power BI skills this month - build one visual each week and tell better stories with data! Get started
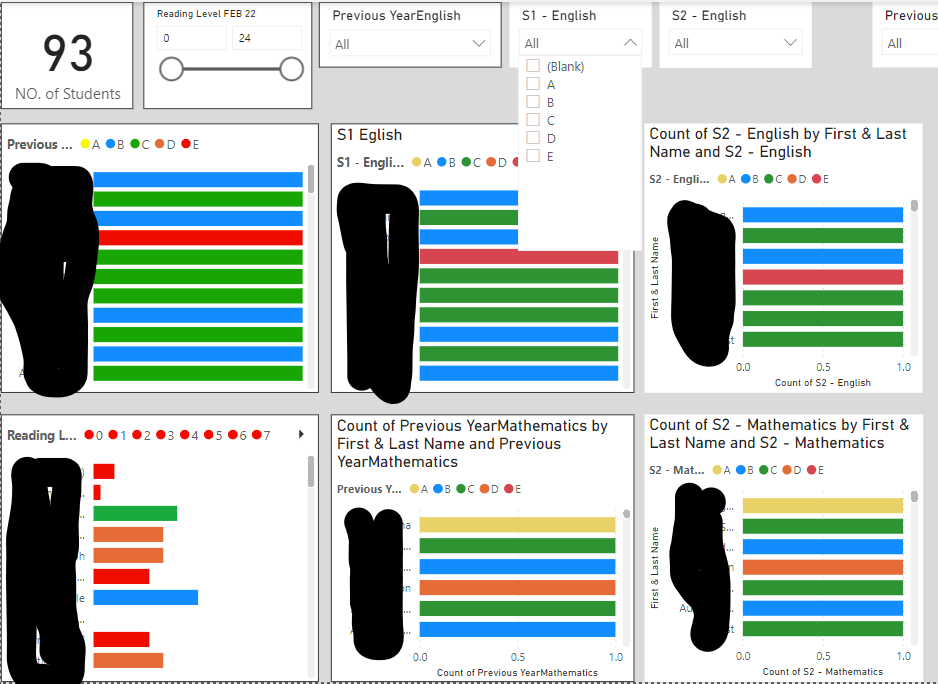
Hi I have a few tables with English A-E data and Maths A-E data how do I make these two tables go on 1 visualization graph and 1 slicer sort A-E
Solved! Go to Solution.
Hi @kettsn ,
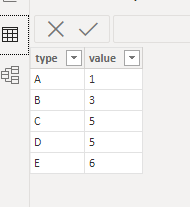
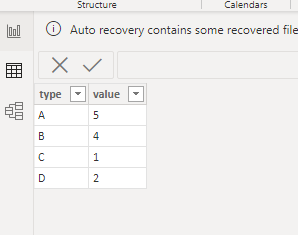
According your describtion,refer the below:
TableA;
TableB:
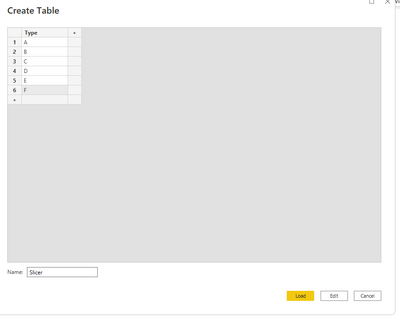
First ,create slicer table:
Then create another table base on tableA and table B:
TableC =
UNION (
SELECTCOLUMNS (
TableA,
"Tpye", TableA[type],
"Table", "TableA",
"Value", TableA[value]
),
SELECTCOLUMNS (
TableB,
"Tpye", TableB[type],
"Table", "TableB",
"Value", TableB[value]
)
)
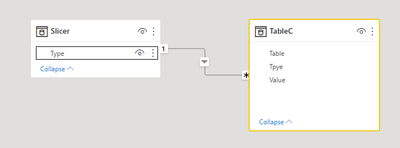
Relationship:
Final output:
Did I answer your question? Mark my post as a solution!
Best Regards
Lucien
Hi,
Share some data and show the expected result.
Hi @kettsn ,
According your describtion,refer the below:
TableA;
TableB:
First ,create slicer table:
Then create another table base on tableA and table B:
TableC =
UNION (
SELECTCOLUMNS (
TableA,
"Tpye", TableA[type],
"Table", "TableA",
"Value", TableA[value]
),
SELECTCOLUMNS (
TableB,
"Tpye", TableB[type],
"Table", "TableB",
"Value", TableB[value]
)
)
Relationship:
Final output:
Did I answer your question? Mark my post as a solution!
Best Regards
Lucien
Hi I tried that solution but it still didnt use 1 slicer to slicer all my graphs. See image below for what I am trying to achieve. I dont want a slicer for each graph. I want to be able to select options base on A-E is this possible
Check out the April 2026 Power BI update to learn about new features.
Sign up to receive a private message when registration opens and key events begin.
If you have recently started exploring Fabric, we'd love to hear how it's going. Your feedback can help with product improvements.
| User | Count |
|---|---|
| 35 | |
| 32 | |
| 26 | |
| 21 | |
| 18 |
| User | Count |
|---|---|
| 68 | |
| 37 | |
| 33 | |
| 23 | |
| 23 |