Hi,
I have an interesting scenario for grouping . I want to group my data in the following way:
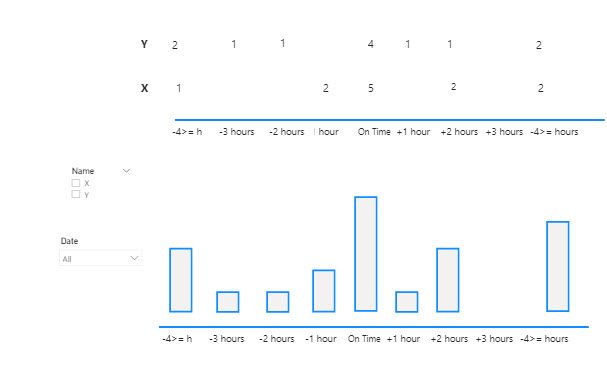
I have two different columns. One of them is for "On time", late, early. The other column gives details such as:
| On time | 2 |
| On time | 1 |
| On time | 0 |
| On time | 0 |
| Late | 1 |
| Early | 2 |
| Late | 1 |
| Early | 2 |
| Early | 5 |
| Early | 6 |
| Late | 5 |
I want to group them: if it is on time it is 0 regardless of On time is 0, 1 or 2. Late is -, early is +. I will count values for early and late. If it is late for 1 hour, it is -1, if it is late for 4 hours more than 4 hours, it will be in the same category. Similar for the early, but it is with + value.
When I select date and name from the slicers, I want to see the data and graph in a similar way that I showed above.
Here is my example data, you can just select and copy-paste to the power bi. Also I have the file available at:https://gofile.io/d/9bSfA2
NameStatusHoursDate
| X | On time | 1 | 12/2/2020 |
| X | On time | 2 | 12/2/2020 |
| X | On time | 0 | 12/2/2020 |
| X | On time | 0 | 12/2/2020 |
| X | On time | 0 | 12/2/2020 |
| X | Late | 1 | 12/2/2020 |
| X | Early | 2 | 12/2/2020 |
| X | Late | 1 | 12/2/2020 |
| X | Early | 2 | 12/2/2020 |
| X | Early | 5 | 12/2/2020 |
| X | Early | 6 | 12/2/2020 |
| X | Late | 5 | 12/2/2020 |
| Y | On time | 1 | 12/2/2020 |
| Y | On time | 0 | 12/2/2020 |
| Y | On time | 0 | 12/2/2020 |
| Y | On time | 0 | 12/2/2020 |
| Y | Late | 8 | 12/2/2020 |
| Y | Late | 5 | 12/2/2020 |
| Y | Early | 5 | 12/2/2020 |
| Y | Late | 2 | 12/2/2020 |
| Y | Early | 4 | 12/2/2020 |
| Y | Early | 2 | 12/2/2020 |
| Y | Early | 1 | 12/2/2020 |
| Y | Late | 3 | 12/2/2020 |
All the best


