
cancel
Showing results for 
Search instead for 
Did you mean: 

July 28 - August 9 | Final Round of the Power BI Dataviz World Championships. This is your chance. Learn more

Reply
Tasos
Helper II
Helper II

create dynamic output

Hello,


I am trying to create something that someone must have done it before. I have seen that there are some similar topics but none of them made me solve my problem 😞 .


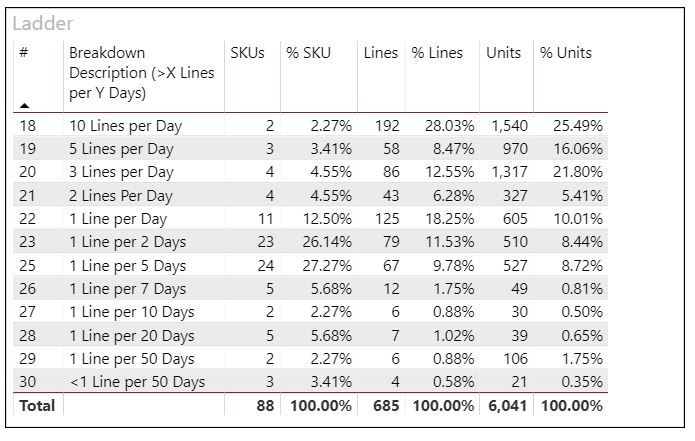
I want to create a dynamic output like the one below (1st group has all the SKUs with more than 10lines per day, the 2nd group has these SKUs with less than 10 and more than 5 lines per day, etc.)

1.JPG

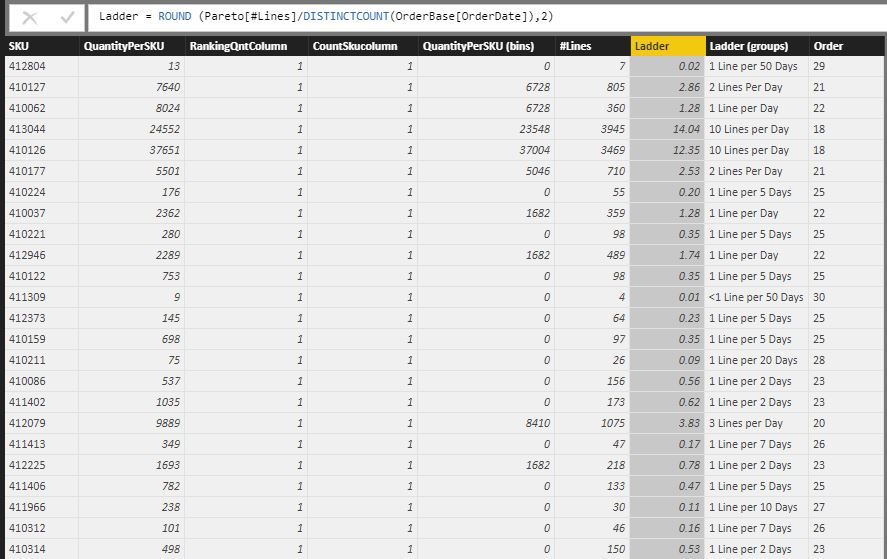
My first approach was to create the value (Ladder) and based on that the grouping as a column. 

2.JPG


However, this is not dynamic as when I apply filters, the "ladder" and the "grouping" remain unchangeable as they are calculated based on the original total values. Therefore, I thought to create a measure instead of a column (probably something like the one below??) I am missing on how I can create the table I want from the measure (if this is the correct approach).


3.JPG 


Hopefully, it is clear what I need.


Thank you

1 ACCEPTED SOLUTION

Hello, I have found what I was looking for. I used the following link and it shows in detail the steps.


https://www.youtube.com/watch?v=0HR_h6YTjzc


Thank you

View solution in original post

3 REPLIES 3
v-jiascu-msft
Microsoft Employee
Microsoft Employee

Hi @Tasos,


Can you share the pbix file please?

What's the table 'OrderBase' like?


Best Regards,

Dale

Community Support Team _ Dale
If this post helps, then please consider Accept it as the solution to help the other members find it more quickly.

Hi @v-jiascu-msft,


Thank you for helping me.


The "orderbase" file is the original file containing details of the orders I want to analyse (per ordernumber). I have summarised it in SKU level (Pareto table) and from this I am trying to create the desired output.


I tried to share the file but haven't hound how.


Thanks,

Tasos

Hello, I have found what I was looking for. I used the following link and it shows in detail the steps.


https://www.youtube.com/watch?v=0HR_h6YTjzc


Thank you

Helpful resources

Announcements
FabCon and SQLCon Barcelona 2026

FabCon & SQLCon – Barcelona 2026

Join us in Barcelona for FabCon and SQLCon, the Fabric, Power BI, SQL, and AI community event. Save €200 with code FABCMTY200.

Fabric Community Sticker Design Challenge Barcelona Carousel

Fabric Community Sticker Challenge - Barcelona 2026

If you love stickers, then you will definitely want to check out our community sticker challenge, Barcelona edition!

July Power BI Update Carousel

Power BI Monthly Update - July 2026

Check out the July 2026 Power BI update to learn about new features.

Power BI DataViz World Championships carousel

Power BI DataViz World Championships - June 2026

A new Power BI DataViz World Championship is coming this June! Don't miss out on submitting your entry.

Top Solution Authors