FabCon is coming to Atlanta
Join us at FabCon Atlanta from March 16 - 20, 2026, for the ultimate Fabric, Power BI, AI and SQL community-led event. Save $200 with code FABCOMM.
Register now!- Power BI forums
- Get Help with Power BI
- Desktop
- Service
- Report Server
- Power Query
- Mobile Apps
- Developer
- DAX Commands and Tips
- Custom Visuals Development Discussion
- Health and Life Sciences
- Power BI Spanish forums
- Translated Spanish Desktop
- Training and Consulting
- Instructor Led Training
- Dashboard in a Day for Women, by Women
- Galleries
- Data Stories Gallery
- Themes Gallery
- Contests Gallery
- QuickViz Gallery
- Quick Measures Gallery
- Visual Calculations Gallery
- Notebook Gallery
- Translytical Task Flow Gallery
- TMDL Gallery
- R Script Showcase
- Webinars and Video Gallery
- Ideas
- Custom Visuals Ideas (read-only)
- Issues
- Issues
- Events
- Upcoming Events
Get Fabric Certified for FREE during Fabric Data Days. Don't miss your chance! Request now
- Power BI forums
- Forums
- Get Help with Power BI
- Desktop
- Re: calculation based on 2 tables with calendar
- Subscribe to RSS Feed
- Mark Topic as New
- Mark Topic as Read
- Float this Topic for Current User
- Bookmark
- Subscribe
- Printer Friendly Page
- Mark as New
- Bookmark
- Subscribe
- Mute
- Subscribe to RSS Feed
- Permalink
- Report Inappropriate Content
calculation based on 2 tables with calendar
i'm having trouble creating a measure to show me calculation from 2 tables.
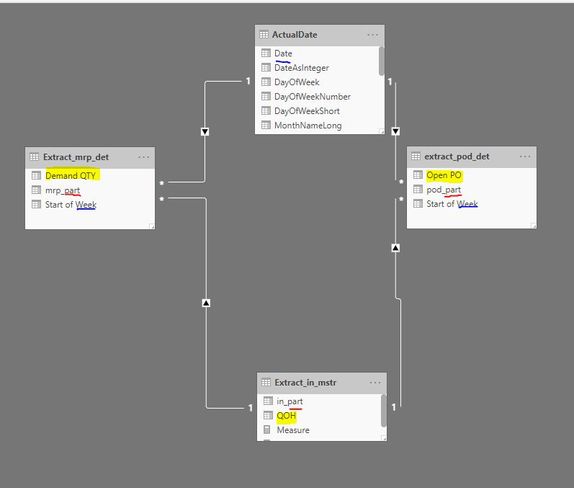
My model looks like this:
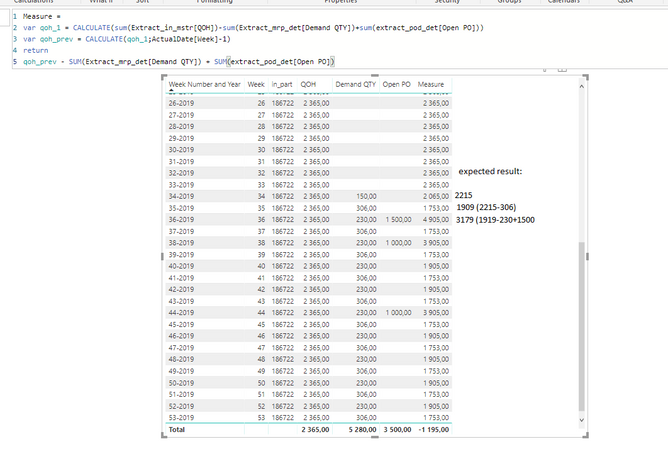
What i would like to achieve is to take starting_QOH (there is just one starting_QOH in in_mstr under in_part) and decuct from this starting_QOH demand for each week and each item and add open PO for each part for each week.
so my expected result is as below (mind i have many of in_part):
i can catch the starting value to make the calculation, would you help?
- Mark as New
- Bookmark
- Subscribe
- Mute
- Subscribe to RSS Feed
- Permalink
- Report Inappropriate Content
HI @mhsk ,
If you can please share some sample data for test, it is hard to test without any sample data.
How to Get Your Question Answered Quickly
Regards,
Xiaoxin Sheng
- Mark as New
- Bookmark
- Subscribe
- Mute
- Subscribe to RSS Feed
- Permalink
- Report Inappropriate Content
Hi, pbix file can be found here:
https://app.box.com/s/jlhtu79kzbmfwkcs018olv5tg43vjfis
Please do not apply changes on query all I have is already imported into the model, the goal is to get Quantity on Hand value for each item and minus it with demand and plus with supply for each week. For next week start should be the previous week end value. @Anonymous Thanks in advance for suggestions and feedback.
- Mark as New
- Bookmark
- Subscribe
- Mute
- Subscribe to RSS Feed
- Permalink
- Report Inappropriate Content
any ideas? what im looking for is a rolling calculation with set start and change week by week
- Mark as New
- Bookmark
- Subscribe
- Mute
- Subscribe to RSS Feed
- Permalink
- Report Inappropriate Content
Hi @mhsk ,
You can use following measure if it suitable your requirement:
Measure =
VAR currDate =
    MAX ( ActualDate[Date] )
RETURN
    SUM ( 'Quantity on Hand'[QOH] )
        - CALCULATE (
            SUM ( demand[Demand QTY] ),
            FILTER ( ALLSELECTED ( ActualDate ), [Date] <= currDate )
        )
        + CALCULATE (
            SUM ( supply[Open PO] ),
            FILTER ( ALLSELECTED ( ActualDate ), [Date] <= currDate )
        )
Regards,
Xiaoxin Sheng
Helpful resources

Power BI Monthly Update - November 2025
Check out the November 2025 Power BI update to learn about new features.

Fabric Data Days
Advance your Data & AI career with 50 days of live learning, contests, hands-on challenges, study groups & certifications and more!

| User | Count |
|---|---|
| 103 | |
| 80 | |
| 62 | |
| 50 | |
| 45 |


