This is best Fabric, Power BI, SQL and AI community event. How do we know? The last event sold out! Save €200 with code FABCMTY200.
Register nowA new Data Days event is coming soon! This time we’re going bigger than ever. Fabric, Power BI, SQL, AI and more. Don't miss out.
Hello! Trying to build what I had assumed was a simple table that is proving much more difficult. My source table is project & team data that looks something like this:
Category Team 1 Team 2 Team 3 Team 4
A 0.5 0 0.6 0.25
A 1.0 0.3 0.5 0
B 0.25 0.75 0 0.5
There are several lines for each category of project - for example, there can be 20 lines of Cat A, 15 of Cat B, etc.
In my dashboard I inserted a table that sums all of the numbers for each column based on Category, with team totals and row totals (inserted as a Calculated Column). So the dashboard table looks something like this, using the data from the example above:
Category Team 1 Team 2 Team 3 Team 4 Total
A 1.5 0.3 1.1 0.25 3.15
B 0.25 0.75 0 0.5 1.5
Total 1.75 1.05 1.1 0.75 4.65
I'm trying to build another table that calculates weighted averages for this data. So for example, I want the number in Category A and Team 1 to calculate this: ((Team 1 total) / (Total total)) * (Team 1 Category A) = ((1.75) / (4.65)) * (1.5). I want this calculation in each of the cells of the table (obviously excluding the Total row/column).
I've tried the Quick Measure for weighted average but couldn't get it to calculate correctly, or have it broken down by the right category (which in this case is named Category). Can anyone help me understand either the way to format the table so I get this information or the DAX equations to use? Thanks!
Solved! Go to Solution.
Hi, try with this:
Step 1: Unpivot Data
Go to Query Editor Select the Category Column and Unpivot Other Columns -- Close & Apply
Step 2: Create a measure:
WeightedAverage = VAR _SumValues=SUM(Table1[Value]) VAR _TeamTotal=CALCULATE(SUM(Table1[Value]),ALL(Table1[Category])) VAR _Total=CALCULATE(SUM(Table1[Value]),ALL(Table1)) RETURN DIVIDE(_TeamTotal ,_Total) * _SumValues
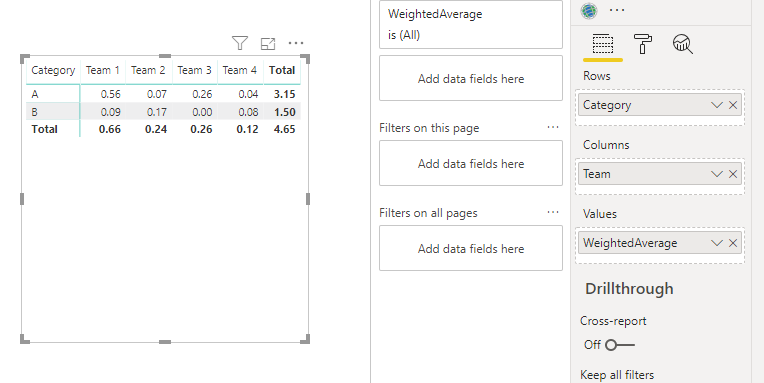
Step3 : Use in a matrix visual
Regards
Victor
Thank you!! It worked!
Hi, try with this:
Step 1: Unpivot Data
Go to Query Editor Select the Category Column and Unpivot Other Columns -- Close & Apply
Step 2: Create a measure:
WeightedAverage = VAR _SumValues=SUM(Table1[Value]) VAR _TeamTotal=CALCULATE(SUM(Table1[Value]),ALL(Table1[Category])) VAR _Total=CALCULATE(SUM(Table1[Value]),ALL(Table1)) RETURN DIVIDE(_TeamTotal ,_Total) * _SumValues
Step3 : Use in a matrix visual
Regards
Victor
Check out the May 2026 Power BI update to learn about new features.
Sign up to receive a private message when registration opens and key events begin.
If you have recently started exploring Fabric, we'd love to hear how it's going. Your feedback can help with product improvements.
| User | Count |
|---|---|
| 31 | |
| 25 | |
| 25 | |
| 22 | |
| 14 |
| User | Count |
|---|---|
| 61 | |
| 49 | |
| 25 | |
| 20 | |
| 20 |