This is best Fabric, Power BI, SQL and AI community event. How do we know? The last event sold out! Save €200 with code FABCMTY200.
Register nowA new Data Days event is coming soon! This time we’re going bigger than ever. Fabric, Power BI, SQL, AI and more. Don't miss out.
Hi,
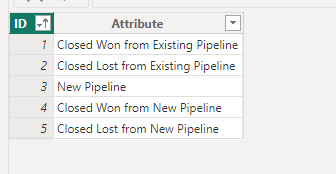
I am trying to build a waterfall chart and sort the breakdown in a specific order. I have a sort order in place for the breakdown in a table, and while the sorting works in a general table, I cannot do so in the matrix. Currently the matrix is sorting on the basis of value and not the attribute order.
Solved! Go to Solution.
Hi @Anonymous ,
So far, to my knowledge, it may be not realizable.
Best regards,
Community Support Team_Binbin Yu
If this post helps, then please consider Accept it as the solution to help the other members find it more quickly.
Sorry I am not able to help> But I have question about how did you added the quarter 1 and 2 at the begging and end of the coulmn I am only able to get the total
Unfortunately, the sorting of breakdowns is not directly available in the current context. However, you can create a chart with Python using Plotly, which allows you to sort the breakdown data as desired.
Please let me know if you need assistance with the code implementation or any further details.
Hi @Anonymous ,
So far, to my knowledge, it may be not realizable.
Best regards,
Community Support Team_Binbin Yu
If this post helps, then please consider Accept it as the solution to help the other members find it more quickly.
Check out the May 2026 Power BI update to learn about new features.
Sign up to receive a private message when registration opens and key events begin.
If you have recently started exploring Fabric, we'd love to hear how it's going. Your feedback can help with product improvements.
| User | Count |
|---|---|
| 32 | |
| 25 | |
| 23 | |
| 22 | |
| 13 |
| User | Count |
|---|---|
| 61 | |
| 47 | |
| 27 | |
| 24 | |
| 19 |