Join us at FabCon Vienna from September 15-18, 2025
The ultimate Fabric, Power BI, SQL, and AI community-led learning event. Save €200 with code FABCOMM.
Get registered- Power BI forums
- Get Help with Power BI
- Desktop
- Service
- Report Server
- Power Query
- Mobile Apps
- Developer
- DAX Commands and Tips
- Custom Visuals Development Discussion
- Health and Life Sciences
- Power BI Spanish forums
- Translated Spanish Desktop
- Training and Consulting
- Instructor Led Training
- Dashboard in a Day for Women, by Women
- Galleries
- Data Stories Gallery
- Themes Gallery
- Contests Gallery
- Quick Measures Gallery
- Notebook Gallery
- Translytical Task Flow Gallery
- TMDL Gallery
- R Script Showcase
- Webinars and Video Gallery
- Ideas
- Custom Visuals Ideas (read-only)
- Issues
- Issues
- Events
- Upcoming Events
Compete to become Power BI Data Viz World Champion! First round ends August 18th. Get started.
- Power BI forums
- Forums
- Get Help with Power BI
- Desktop
- Waterfall Chart - Data formatting for Total Bar no...
- Subscribe to RSS Feed
- Mark Topic as New
- Mark Topic as Read
- Float this Topic for Current User
- Bookmark
- Subscribe
- Printer Friendly Page
- Mark as New
- Bookmark
- Subscribe
- Mute
- Subscribe to RSS Feed
- Permalink
- Report Inappropriate Content
Waterfall Chart - Data formatting for Total Bar not working when using Format String Expression
Hi everyone,
I run into a weird issue today for which I wasn't able to find a solution online.
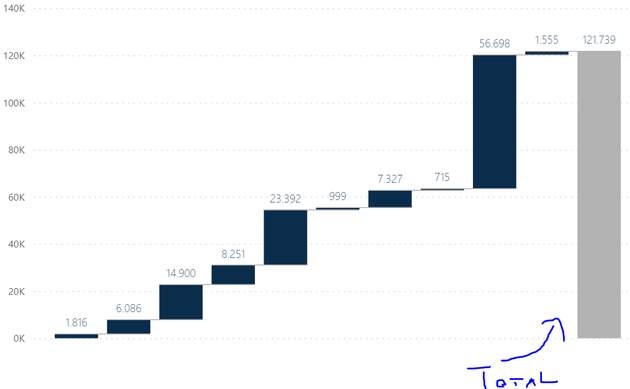
Basically, I have a waterfall chart that shows the number of orders for several companies and then sums them in the final "Total" bar. The number of orders is calculated in a measure. Below is how it should look (with a dot separating the thousands).
Aside from that, I created (using Tabular Editor) a calculation group that I use in a different part of the model to implement a currency conversion (here's a link to the tutorial I followed https://www.youtube.com/watch?v=-REAQDqdz0A). In order to dynamically change the format of the currencies, I modified the field "Format String Expression" of the calculation items.
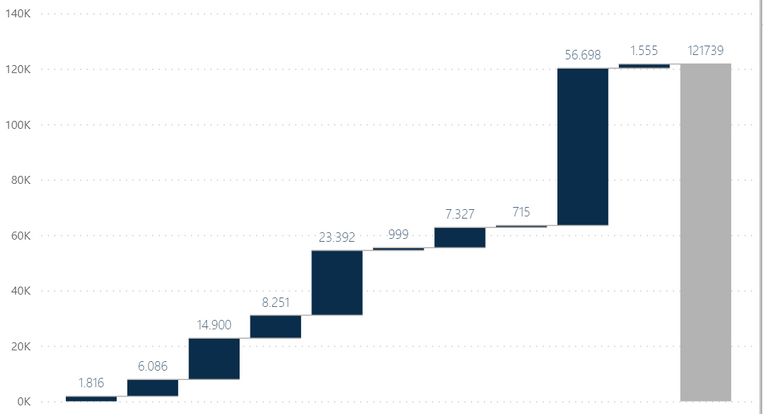
Now, the problem is, when I modify the "Format String Expression" field, the total bar in the waterfall chart stops formatting the numbers correctly (below how it looks after modifying the formatting for just one calculation item - the thousand separator is now gone).
I tested several other measure on the graph and they all showed the same behaviour - on every column the formatting is correct, then on the total column the format is lost.
I tried creating a calculation item specifically for the measure, formatted as the measure, to use as a filter on this chart, but, again, same problem.
The chart works fine if no "Format String Expression" is used, then, as soon as one such field is changed, the total bar starts messing up the formatting.
I can't understand what's wrong, since the two things are apparently completely unrelated.
Does anyone know what the problem might be?
Thanks
- Mark as New
- Bookmark
- Subscribe
- Mute
- Subscribe to RSS Feed
- Permalink
- Report Inappropriate Content
I have the same problem - presence of calculation groups in model (even if they are not being used) stop the waterfall chart from using the format string of the measures when 'Breakdown' field of the visual is being used. (Also tried in vain as a work around to to use a calculation item to put in a format string but that does not work either). This seems to be the same bug as the bug that used to exist in the donut chart (except instead of 'Breakdown' well it was the 'Details' well).
- Mark as New
- Bookmark
- Subscribe
- Mute
- Subscribe to RSS Feed
- Permalink
- Report Inappropriate Content
Hi @Anonymous
Could you provide your measure and sample data?
Best Regards,
Link


