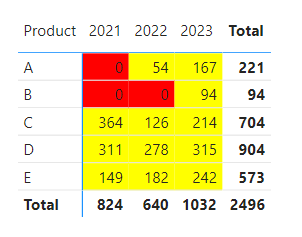
@Rohit001 assuming you have calendar table that you are using to show year on the columns of the matrix visual:
Add following measure which will give you count of years with zero sales and then you can use that to set the color and then further use it for conditional formatting:
Color =
VAR __SalesByProduct =
ADDCOLUMNS (
    SUMMARIZE ( ALLSELECTED ( 'Calendar'[Year] ), 'Calendar'[Year] ),
    "@Sale", [Sales Measure]
)
VAR __CountYearsWithZeroSales = COUNTROWS ( FILTERS ( __SalesByProduct, [@Sale] = 0 ) )
RETURN
SWITCH (
    __CountYearsWithZeroSales,
    1, "Red",
    2, "Green"
)
Subscribe to the @PowerBIHowTo YT channel for an upcoming video on List and Record functions in Power Query!!
Learn Power BI and Fabric - subscribe to our YT channel - Click here: @PowerBIHowTo
If my solution proved useful, I'd be delighted to receive Kudos. When you put effort into asking a question, it's equally thoughtful to acknowledge and give Kudos to the individual who helped you solve the problem. It's a small gesture that shows appreciation and encouragement! ❤
Did I answer your question? Mark my post as a solution. Proud to be a Super User! Appreciate your Kudos 🙂
Feel free to email me with any of your BI needs.