Get certified for free when you join Fabric Data Days 2026 and dive into Fabric, Power BI, SQL, AI, and other essential data skills.
Join nowJuly 7 - July 17 | Round 2 of the Power BI Dataviz World Championships. Don't miss your chance! Learn more
I have an Excel log that displays incidents. We have a column for "body part" injured, and sometimes there are multiple values inputted, such as arm/finger, knee/leg, etc. I would like to put these values into a pie chart or another visual and break them up into individual categories so that Power Bi recognizes arm as one value, finger as one value, etc. Since the log is updated on an ungoing basis, I would also like to set up some type of rule in Power Bi so that when new data is inputted, it recognizes these as distinct values. How can I achieve this?
Solved! Go to Solution.
Hi @ld17
To break up multiple values into individual values, you can use the Split columns by delimiter feature in Power Query Editor. By default, it splits the chosen column into multiple columns. You can expand Advanced options section and select Rows instead. In this way it will expand the rows that have multiple values into multiple rows with all category values in the same column.
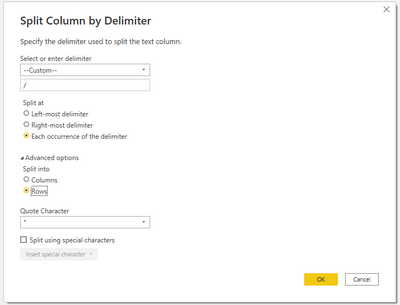
I'm not sure if you want to make a category table with distinct values? If so, you can duplicate the query and remove all other columns except the category column. Then use Remove Rows > Remove Duplicates to keep only distinct category values in the query. Apply the queries into Power BI. Then create a relationship between the category table and the Incidents table on category column. If you want to use a pie chart, put category column on Legend.
Best Regards,
Community Support Team _ Jing
If this post helps, please Accept it as Solution to help other members find it.
Hi @ld17
To break up multiple values into individual values, you can use the Split columns by delimiter feature in Power Query Editor. By default, it splits the chosen column into multiple columns. You can expand Advanced options section and select Rows instead. In this way it will expand the rows that have multiple values into multiple rows with all category values in the same column.
I'm not sure if you want to make a category table with distinct values? If so, you can duplicate the query and remove all other columns except the category column. Then use Remove Rows > Remove Duplicates to keep only distinct category values in the query. Apply the queries into Power BI. Then create a relationship between the category table and the Incidents table on category column. If you want to use a pie chart, put category column on Legend.
Best Regards,
Community Support Team _ Jing
If this post helps, please Accept it as Solution to help other members find it.
Join us in Barcelona for FabCon and SQLCon, the Fabric, Power BI, SQL, and AI community event. Save €200 with code FABCMTY200.
Join Data Days 2026: 60 days of free live/on-demand sessions, challenges, study groups, and certification opportunities.
| User | Count |
|---|---|
| 28 | |
| 23 | |
| 18 | |
| 18 | |
| 15 |
| User | Count |
|---|---|
| 47 | |
| 44 | |
| 43 | |
| 38 | |
| 32 |