cancel
Showing results for 
Search instead for 
Did you mean: 

July 7 - July 17 | Round 2 of the Power BI Dataviz World Championships. Don't miss your chance! Learn more

Reply
millerz1
Frequent Visitor

Visualization interacting with data model

Hello,


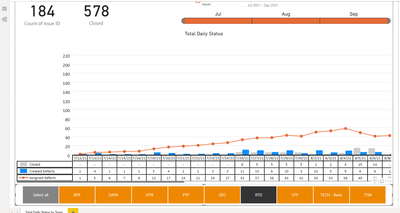
I am trying to create a chart where I can interact with it by selecting the relevant team to see the number of open, closed, and assigned defects by date.  However, the relationship between the two tables (date table I created based off a Power BI article) doesn't appear to be working as I would expect.  When a select a specific team in the bottom splicer, there is no change to the graph.


millerz1_0-1631659375390.png


Any help would be greatly appreciated!  


Link to files 

4 REPLIES 4
Anonymous
Not applicable

@millerz1 
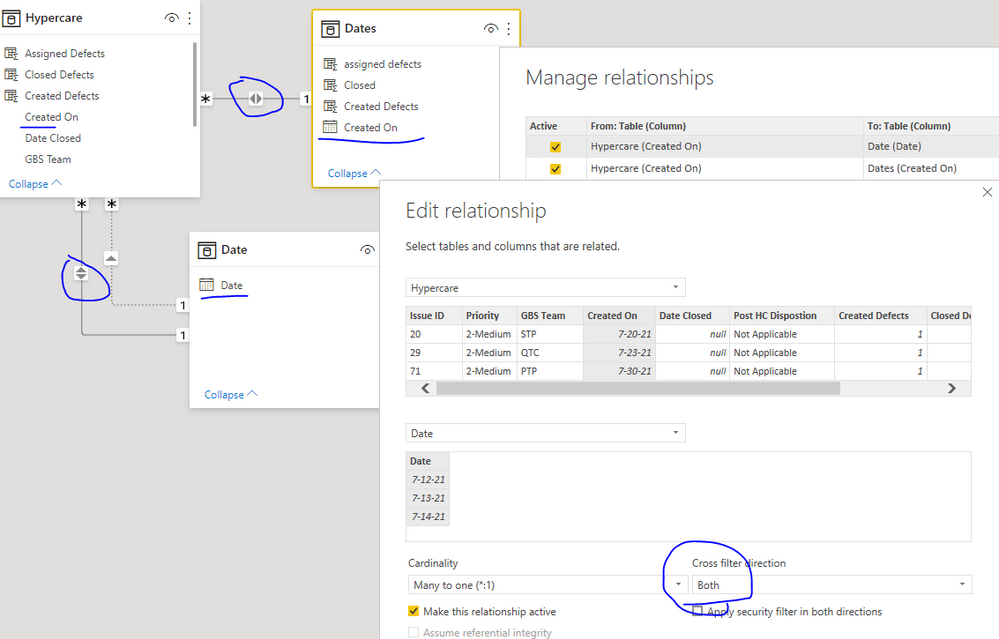
Based on the provided pbix, there is no relationship created between the dates table and Hypercare table, so you cannot use the GBS team to filer the line value [assigned defects]. Just add a relationship using Created On column should work. And you should change the the filter direction to both since you want to use the GBS team in the Hypercare table to filter the other 2 table columns.


relationship.PNG


Paul Zheng _ Community Support Team
If this post helps, please Accept it as the solution to help the other members find it more quickly.

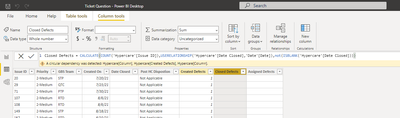
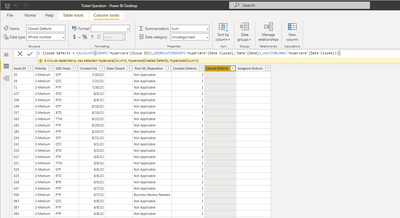
@Anonymous  @amitchandak Thanks!  That resolved the "Created Defects" working with the visuals.  However, I am still getting circular dependencies on the "Closed Defects" and "Assigned Defects".


millerz1_0-1631891842148.png


millerz1_1-1631891863733.png


After some digging around, does this have to do with having multiple "Calculate" columns in the same table?

Any help is greatly appreciated.


amitchandak
Super User
Super User

@millerz1 , Refer this blog on a similar topic can help


https://community.powerbi.com/t5/Community-Blog/HR-Analytics-Active-Employee-Hire-and-Termination-tr...


or


Distributing/Allocating the Yearly Target(Convert to Daily Target): https://community.powerbi.com/t5/Community-Blog/Distributing-Allocating-the-Yearly-Target-Convert-to...


Share with Power BI Enthusiasts: Full Power BI Video (20 Hours) YouTube
Microsoft Fabric Series 60+ Videos YouTube
Microsoft Fabric Hindi End to End YouTube

Thank you, I am getting closer.  Now I am not quite sure what I am doing wrong with the relationships.  I am getting circular dependecy errors.  Per the article, I tried swapping around the formula's and dropping the "userelationship" when activating/deactivating the relationships.  Updated the attached PBIX.  Any help would be greatly appreciated.

millerz1_0-1631713683785.png


Helpful resources

Announcements
FabCon and SQLCon Barcelona 2026

FabCon & SQLCon – Barcelona 2026

Join us in Barcelona for FabCon and SQLCon, the Fabric, Power BI, SQL, and AI community event. Save €200 with code FABCMTY200.

60 days of Data Days Carousel

Data Days 2026

Join Data Days 2026: 60 days of free live/on-demand sessions, challenges, study groups, and certification opportunities.

Power BI DataViz World Championships carousel

Power BI DataViz World Championships - June 2026

A new Power BI DataViz World Championship is coming this June! Don't miss out on submitting your entry.

Top Solution Authors