Get certified for free when you join Fabric Data Days 2026 and dive into Fabric, Power BI, SQL, AI, and other essential data skills.
Join nowJuly 7 - July 17 | Round 2 of the Power BI Dataviz World Championships. Don't miss your chance! Learn more
Hi,
I am not sure if this is the default feature on PowerBI or not but I noticed that the design of one of the Visuals on our report is changed.
I am using Tachometer visual and Callout Value peoperty was OFF before but now it is ON.
Also, is there any way to find out what the version of Visual report is using or on Visualizations tab on BI Desktop?
As Tachometer visual is a 3rd party visual, I think you'll get better response from the author([email protected]).
I mean, in general not only 3rd party components, after visual components are updated, will my report use the latest components that are updated? or my report uses original version of components that I used when I designed?
@YDEGUCHI wrote:
I mean, in general not only 3rd party components, after visual components are updated, will my report use the latest components that are updated? or my report uses original version of components that I used when I designed?
There's no any official documentation talking about the update, but I'd bet that most properly it won't update the already imported custom visual. Because Power BI allow developping custom visuals, you can use the visuals in Power BI without publishing them to the custom visual gallery. Then for the ones not published, from where does Power BI update them?
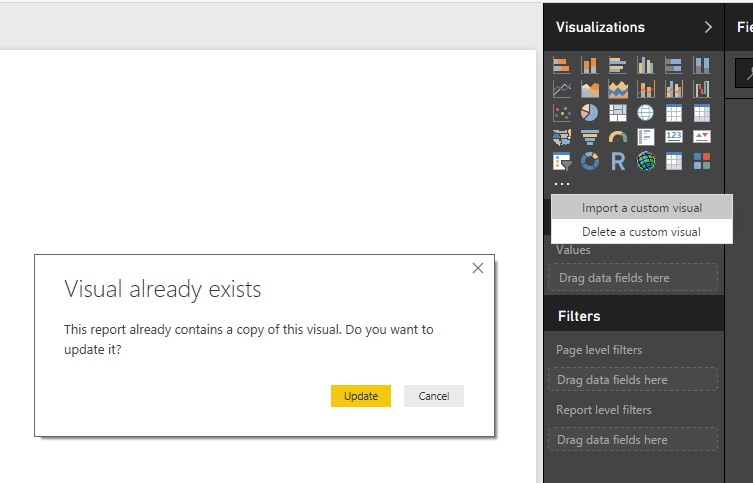
To update the custom visuals, you can try to import the new version visuals.
Join us in Barcelona for FabCon and SQLCon, the Fabric, Power BI, SQL, and AI community event. Save €200 with code FABCMTY200.
Join Data Days 2026: 60 days of free live/on-demand sessions, challenges, study groups, and certification opportunities.
| User | Count |
|---|---|
| 28 | |
| 23 | |
| 18 | |
| 18 | |
| 15 |
| User | Count |
|---|---|
| 49 | |
| 44 | |
| 43 | |
| 39 | |
| 32 |