Get certified for free when you join Fabric Data Days 2026 and dive into Fabric, Power BI, SQL, AI, and other essential data skills.
Join nowJuly 28 - August 9 | Final Round of the Power BI Dataviz World Championships. This is your chance. Learn more
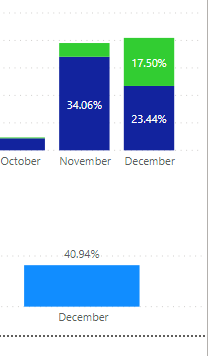
Hi Have 2 graphs - the 1st is showing me the percentage of jobs over the year - so for example Dec equals 40.94%.
I then have a second graph that shows me these jobs broken down into 2 x categories - YES/NO.
In dec - these are showing as 33.13% and 7.81% - how can i change this so they are not the % of year, but for Dec so that they equal 100%?
@LYeo87 , You have try measures like
divide(sum(Table[total]),calculate(sum(Table[total]) , allexcept(Table, Table[month Year])))
divide(sum(Table[total]),calculate(sum(Table[total]) , filter(allselected(Table), Table[key#] =max(Table[month Year]))))
also refer
https://community.powerbi.com/t5/Desktop/Percentage-of-subtotal/td-p/95390
Hi @LYeo87 ,
Can you please provide sample data and expected output?
You will need to use either of ALL, ALLSELECTED or ALLEXCEPT in your DAX but which one to use will be based on your data.
Give a thumbs up if this post helped you in any way and mark this post as solution if it solved your query !!!
Top graph is used with a new column - IF statement. Buttom is purely totals
Hi @LYeo87 ,
Could you please share some sample data and applied fields/measures on your two graph in order to provide you a suitable solution? If there is any measure applied on the graph, please also provide the related formula. Thank you.
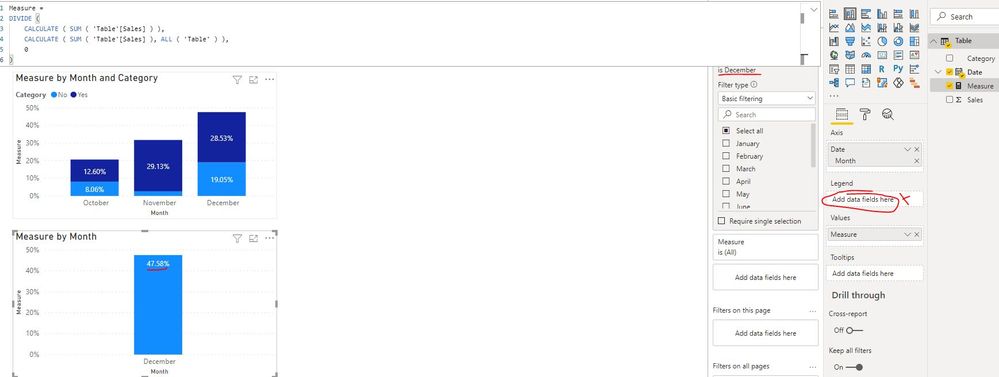
In addition, I created a sample pbix file(see attachment) for you. Please check whether that is what you want.
Best Regards
If you love stickers, then you will definitely want to check out our community sticker challenge, Barcelona edition!
Check out the July 2026 Power BI update to learn about new features.
| User | Count |
|---|---|
| 30 | |
| 28 | |
| 23 | |
| 21 | |
| 19 |
| User | Count |
|---|---|
| 39 | |
| 31 | |
| 18 | |
| 17 | |
| 15 |