This is best Fabric, Power BI, SQL and AI community event. How do we know? The last event sold out! Save €200 with code FABCMTY200.
Register nowA new Data Days event is coming soon! This time we’re going bigger than ever. Fabric, Power BI, SQL, AI and more. Don't miss out.
Hi All,
We have call centre data with a comments field loaded into Power BI. I was hoping to create a report where users could search/filter out multiple key words.
For instance, I want to find anyone that has commented on "Insurance" and "Storm" within the 1 string/comment.
Our call centre system is not the smartest and people have relied on writing Excel functions to do these searches previously.
Cheers,
Dan
Solved! Go to Solution.
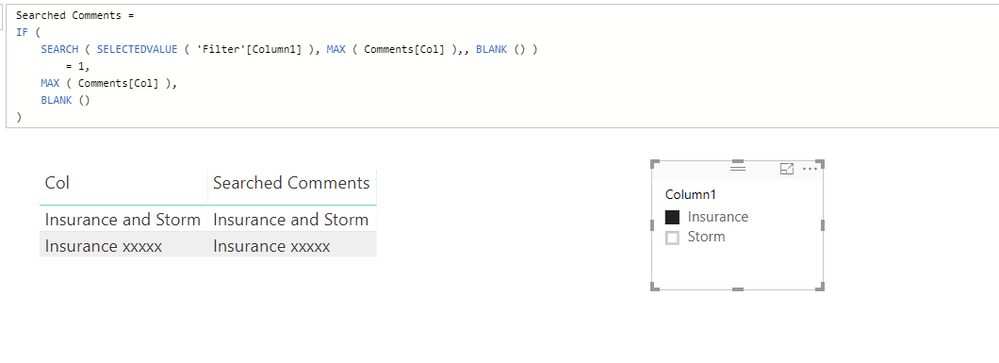
To achieve your requirement, you can create a slicer table then use this slicer table to filter the comments. Please refer to following sample:
The comparison measure is like:
Searched Comments =
IF (
SEARCH ( SELECTEDVALUE ( 'Filter'[Column1] ), MAX ( Comments[Col] ),, BLANK () )
= 1,
MAX ( Comments[Col] ),
BLANK ()
)
Thanks,
Xi Jin.
I've tried dropping two or more standard Microsoft Text filter visuals onto the page. The only downside is that it will always work like the 'AND' function. Also used a combo of the Microsoft Text filter visual with the WordCloud visualisation. The handy thing about the Word cloud visual is you can use the CTRL key to choose multiple combinations of words to filter on.
To achieve your requirement, you can create a slicer table then use this slicer table to filter the comments. Please refer to following sample:
The comparison measure is like:
Searched Comments =
IF (
SEARCH ( SELECTEDVALUE ( 'Filter'[Column1] ), MAX ( Comments[Col] ),, BLANK () )
= 1,
MAX ( Comments[Col] ),
BLANK ()
)
Thanks,
Xi Jin.
I was able to get this DAX formula to work but had two follow-up questions.
1. Is there a way to only show one of the two columns? If I remove one of the columns from my table, then the filtering no longer works and I would prefer not to show two identical columns in my table.
2. This filtering solution has significantly slowed down my report (table is over 100K row when not filtered). Is there an alternative that might run faster?
Hi,
Try the Wordcloud custom visual. You can download that free from the Custom Visual store.
Check out the May 2026 Power BI update to learn about new features.
Sign up to receive a private message when registration opens and key events begin.
If you have recently started exploring Fabric, we'd love to hear how it's going. Your feedback can help with product improvements.
| User | Count |
|---|---|
| 32 | |
| 25 | |
| 23 | |
| 22 | |
| 13 |
| User | Count |
|---|---|
| 61 | |
| 47 | |
| 27 | |
| 24 | |
| 19 |