This is best Fabric, Power BI, SQL and AI community event. How do we know? The last event sold out! Save €200 with code FABCMTY200.
Register nowA new Data Days event is coming soon! This time we’re going bigger than ever. Fabric, Power BI, SQL, AI and more. Don't miss out.
I have below "values" table:
Account | Client | Service Line | Ops Geo | Year | Period | Scenario | Data Source | Currency | Measure | Manager | RVP | [Values] | COR | GDR Total | COR Value | Revenue | Revenue Value | SGA | SGA Value |
| 1000 | 100 | Finance | Oshkosh | 2020 | 1 | Budget | Input | USD | Value | ABS | DGS | 400 | Revenue | 0 | Revenue | 400 | 0 | ||
| 1000 | 200 | Accounting | Regina | 2020 | 2 | Budget | Input | USD | Value | ABS | DGS | 400 | Revenue | 0 | Revenue | 400 | 0 | ||
| 1000 | 100 | IT | Oshkosh | 2020 | 3 | Budget | Input | USD | Value | ABS | DGS | 400 | Revenue | 0 | Revenue | 400 | 0 | ||
| 2000 | 200 | Finance | Regina | 2020 | 4 | Budget | Input | USD | Value | ABS | DGS | 200 | COR | COR | 200 | 0 | 0 | ||
| 2000 | 100 | Accounting | Oshkosh | 2020 | 5 | Budget | Input | USD | Value | ABS | DGS | 100 | COR | COR | 100 | 0 | 0 | ||
| 2000 | 200 | IT | Regina | 2020 | 6 | Budget | Input | USD | Value | ABS | DGS | 200 | COR | COR | 200 | 0 | 0 | ||
| 3000 | 100 | Finance | Oshkosh | 2020 | 7 | Budget | Input | USD | Value | ABS | DGS | 100 | SGA | 0 | 0 | SGA | 100 | ||
| 3000 | 200 | Accounting | Regina | 2020 | 8 | Budget | Input | USD | Value | ABS | DGS | 200 | SGA | 0 | 0 | SGA | 200 | ||
| 3000 | 100 | IT | Oshkosh | 2020 | 9 | Budget | Input | USD | Value | ABS | DGS | 100 | SGA | 0 | 0 | SGA | 100 | ||
| 1000 | 200 | Marketing | Regina | 2020 | 10 | Budget | Input | USD | Value | ABS | DGS | 200 | Revenue | 0 | Revenue | 200 | 0 | ||
| 1000 | 100 | Finance | Oshkosh | 2020 | 1 | Actual | Input | USD | Value | ABS | DGS | 500 | Revenue | 0 | Revenue | 500 | 0 | ||
| 1000 | 200 | Accounting | Regina | 2020 | 2 | Actual | Input | USD | Value | ABS | DGS | 500 | Revenue | 0 | Revenue | 500 | 0 | ||
| 1000 | 100 | IT | Oshkosh | 2020 | 3 | Actual | Input | USD | Value | ABS | DGS | 300 | Revenue | 0 | Revenue | 300 | 0 | ||
| 2000 | 200 | Finance | Regina | 2020 | 4 | Actual | Input | USD | Value | ABS | DGS | 200 | COR | COR | 200 | 0 | 0 | ||
| 2000 | 100 | Accounting | Oshkosh | 2020 | 5 | Actual | Input | USD | Value | ABS | DGS | 200 | COR | COR | 200 | 0 | 0 | ||
| 2000 | 200 | IT | Regina | 2020 | 6 | Actual | Input | USD | Value | ABS | DGS | 100 | COR | COR | 100 | 0 | 0 | ||
| 3000 | 100 | Finance | Oshkosh | 2020 | 7 | Actual | Input | USD | Value | ABS | DGS | 200 | SGA | 0 | 0 | SGA | 200 | ||
| 3000 | 200 | Accounting | Regina | 2020 | 8 | Actual | Input | USD | Value | ABS | DGS | 100 | SGA | 0 | 0 | SGA | 100 | ||
| 3000 | 100 | IT | Oshkosh | 2020 | 9 | Actual | Input | USD | Value | ABS | DGS | 200 | SGA | 0 | 0 | SGA | 200 | ||
| 1000 | 200 | Marketing | Regina | 2020 | 10 | Actual | Input | USD | Value | ABS | DGS | 100 | Revenue | 0 | Revenue | 100 | 0 |
I created the following measures:
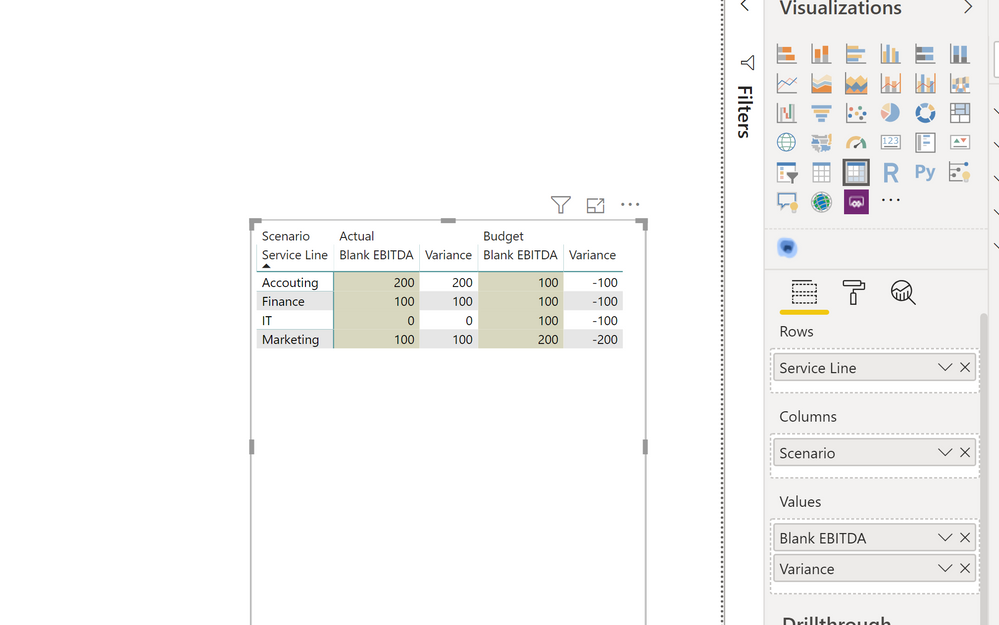
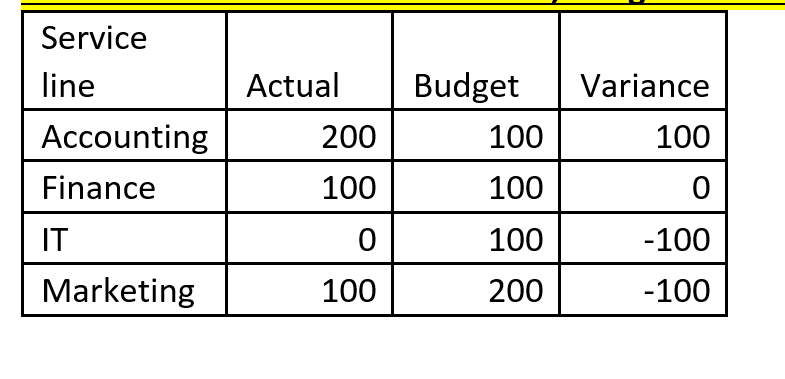
How can I build a table that would show EBITDA as?:
@Anonymous I think it should be something like this, add the following measure and put in matrix visual.
Base Sum = SUM ( Table[Amount] )
Actual = CALCULATE ( [Base Sum], Table[Scenario] = "Actual" )
Budget = CALCULATE ( [Base Sum], Table[Scenario] = "Budget" )
Variance = [Actual] - [Budget]
I would ❤ Kudos if my solution helped. 👉 If you can spend time posting the question, you can also make efforts to give Kudos whoever helped to solve your problem. It is a token of appreciation!
Subscribe to the @PowerBIHowTo YT channel for an upcoming video on List and Record functions in Power Query!!
Learn Power BI and Fabric - subscribe to our YT channel - Click here: @PowerBIHowTo
If my solution proved useful, I'd be delighted to receive Kudos. When you put effort into asking a question, it's equally thoughtful to acknowledge and give Kudos to the individual who helped you solve the problem. It's a small gesture that shows appreciation and encouragement! ❤
Did I answer your question? Mark my post as a solution. Proud to be a Super User! Appreciate your Kudos 🙂
Feel free to email me with any of your BI needs.

@parry2k , thank you for the reply.
I modified your solution to get the answer.
I am looking for EBITDA number which is Revenue - Expense (sum of COR and SGA) .
My equation:
@Anonymous
You may try ISINSCOPE to change the total.
Check out the May 2026 Power BI update to learn about new features.
Sign up to receive a private message when registration opens and key events begin.
If you have recently started exploring Fabric, we'd love to hear how it's going. Your feedback can help with product improvements.
| User | Count |
|---|---|
| 31 | |
| 26 | |
| 23 | |
| 22 | |
| 13 |
| User | Count |
|---|---|
| 61 | |
| 47 | |
| 27 | |
| 23 | |
| 18 |