Get certified for free when you join Fabric Data Days 2026 and dive into Fabric, Power BI, SQL, AI, and other essential data skills.
Join nowJuly 7 - July 17 | Round 2 of the Power BI Dataviz World Championships. Don't miss your chance! Learn more
Hi Community,
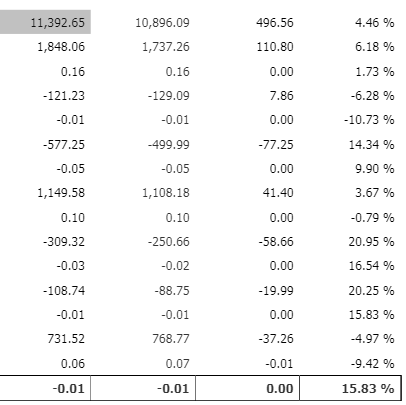
I'm trying to create measures using variables in Power BI, but in the final result I'm not able to save the result as a numerical value which is not allowing me to aggregate the values. I used format and values both the options.
Please help how to fix this.
Solved! Go to Solution.
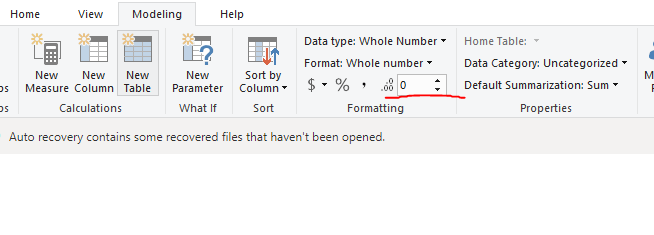
Remove the call to FORMAT() as that is what is converting the result to a string. Instead set the formatting of the measure using the Formatting section of the Modeling tab in the ribbon
RETURN
SWITCH(TRUE(),
MAX('P&L MAPPING'[ACC DESCRIPTION])="TOTALVOLLY",FORMAT(TOTALVOL_LY,"###0.##0"),
MAX('P&L MAPPING'[ACC DESCRIPTION])="TOTALGTOLY",FORMAT(TOTALGTO_LY/1000,"###0.##0")
RETURN
SWITCH(TRUE(),
MAX('P&L MAPPING'[ACC DESCRIPTION])="TOTALVOLLY",VALUE(FORMAT(TOTALVOL_LY,"###0.##0")),
MAX('P&L MAPPING'[ACC DESCRIPTION])="TOTALGTOLY",VALUE(FORMAT(TOTALGTO_LY/1000,"###0.##0"))
Hi @Anonymous ,
Please format the value here.
If it doesn't meet your requirement, kindly share your sample data and excepted result to me if you don't have any Confidential Information. Please upload your files to One Drive and share the link here.
Remove the call to FORMAT() as that is what is converting the result to a string. Instead set the formatting of the measure using the Formatting section of the Modeling tab in the ribbon
@Anonymous,
Please provide more details so everyone can help you better.
Join us in Barcelona for FabCon and SQLCon, the Fabric, Power BI, SQL, and AI community event. Save €200 with code FABCMTY200.
Join Fabric Data Days 2026: 60 days of free live/on-demand sessions, challenges, study groups, and certification opportunities.
| User | Count |
|---|---|
| 24 | |
| 23 | |
| 17 | |
| 14 | |
| 13 |
| User | Count |
|---|---|
| 63 | |
| 41 | |
| 39 | |
| 39 | |
| 38 |