FabCon is coming to Atlanta
Join us at FabCon Atlanta from March 16 - 20, 2026, for the ultimate Fabric, Power BI, AI and SQL community-led event. Save $200 with code FABCOMM.
Register now!- Power BI forums
- Get Help with Power BI
- Desktop
- Service
- Report Server
- Power Query
- Mobile Apps
- Developer
- DAX Commands and Tips
- Custom Visuals Development Discussion
- Health and Life Sciences
- Power BI Spanish forums
- Translated Spanish Desktop
- Training and Consulting
- Instructor Led Training
- Dashboard in a Day for Women, by Women
- Galleries
- Data Stories Gallery
- Themes Gallery
- Contests Gallery
- QuickViz Gallery
- Quick Measures Gallery
- Visual Calculations Gallery
- Notebook Gallery
- Translytical Task Flow Gallery
- TMDL Gallery
- R Script Showcase
- Webinars and Video Gallery
- Ideas
- Custom Visuals Ideas (read-only)
- Issues
- Issues
- Events
- Upcoming Events
The Power BI Data Visualization World Championships is back! It's time to submit your entry. Live now!
- Power BI forums
- Forums
- Get Help with Power BI
- Desktop
- Re: Using Values from Previous Dates
- Subscribe to RSS Feed
- Mark Topic as New
- Mark Topic as Read
- Float this Topic for Current User
- Bookmark
- Subscribe
- Printer Friendly Page
- Mark as New
- Bookmark
- Subscribe
- Mute
- Subscribe to RSS Feed
- Permalink
- Report Inappropriate Content
Using Values from Previous Dates
I have an issue where I would like for a month to show the 67% of the company's value for 2 months ago plus 33% of the company's value for the previous month as I would like to try to compare the values to the current month's sales (could be in 2 different tables ). I added a column (Next month) that would project the next month out. I wrote the following code that I thought would accomplish this but I am getting odd results
Pushed Amount =
var amount = Sheet2[Sale Amount]
var month1 = Sheet2[Next Date]
var month2 = PREVIOUSMONTH(Sheet2[Next Date])
var dealdate =Sheet2[Deal Date]
var saleamount = Sheet2[Sale Amount]
var company = Sheet2[Company]
var pushamount =
iferror(CALCULATE(SUM(Sheet2[Sale Amount]), Sheet2[Deal Date] = month2,Sheet2[Company] = company),0)*.67 + iferror(CALCULATE(SUM(Sheet2[Sale Amount]), Sheet2[Deal Date] = month1, Sheet2[Company] = company),0)*.33

return
pushamount
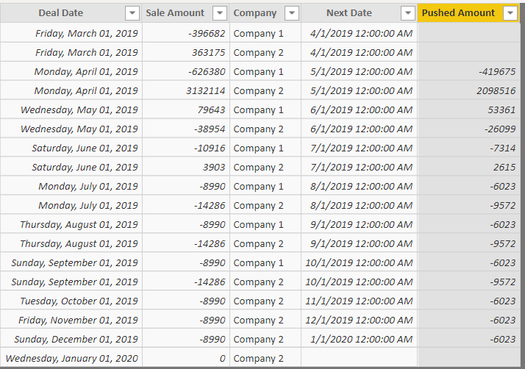
These are the results that I am getting:
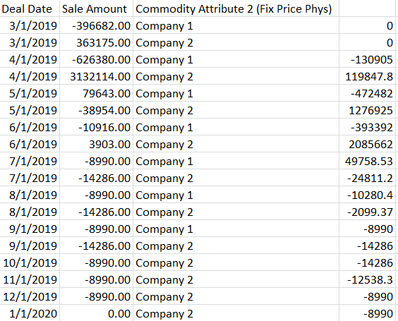
Should produce the same values as in the table below:
Solved! Go to Solution.
- Mark as New
- Bookmark
- Subscribe
- Mute
- Subscribe to RSS Feed
- Permalink
- Report Inappropriate Content
Solved this by creating a date table and a mesaure, code for the measure below
Measure =
var month1 = CALCULATE(SUM(Sheet2[Sale Amount]),DATEADD('date'[Date],-1,MONTH))
var month2 = CALCULATE(SUM(Sheet2[Sale Amount]),DATEADD('date'[Date],-2,MONTH))
return
.33*month1+.67*month2
One thing that tripped me up was using the incorrect date column when creating visualizations. I was using the one in my original table when I should have been using the one from the date table. If you are getting the exact same number in the same month then this is likely why
- Mark as New
- Bookmark
- Subscribe
- Mute
- Subscribe to RSS Feed
- Permalink
- Report Inappropriate Content
Hi,
Why do you want that result as a calculated column - why not a measure? Share the link from where i can download the PBI file.
Regards,
Ashish Mathur
http://www.ashishmathur.com
https://www.linkedin.com/in/excelenthusiasts/
- Mark as New
- Bookmark
- Subscribe
- Mute
- Subscribe to RSS Feed
- Permalink
- Report Inappropriate Content
I'm open to using a measure instead, I'm not sure when to use one instead of another
- Mark as New
- Bookmark
- Subscribe
- Mute
- Subscribe to RSS Feed
- Permalink
- Report Inappropriate Content
Solved this by creating a date table and a mesaure, code for the measure below
Measure =
var month1 = CALCULATE(SUM(Sheet2[Sale Amount]),DATEADD('date'[Date],-1,MONTH))
var month2 = CALCULATE(SUM(Sheet2[Sale Amount]),DATEADD('date'[Date],-2,MONTH))
return
.33*month1+.67*month2
One thing that tripped me up was using the incorrect date column when creating visualizations. I was using the one in my original table when I should have been using the one from the date table. If you are getting the exact same number in the same month then this is likely why
Helpful resources
| User | Count |
|---|---|
| 49 | |
| 37 | |
| 33 | |
| 22 | |
| 18 |
| User | Count |
|---|---|
| 132 | |
| 99 | |
| 56 | |
| 37 | |
| 37 |


