FabCon is coming to Atlanta
Join us at FabCon Atlanta from March 16 - 20, 2026, for the ultimate Fabric, Power BI, AI and SQL community-led event. Save $200 with code FABCOMM.
Register now!- Power BI forums
- Get Help with Power BI
- Desktop
- Service
- Report Server
- Power Query
- Mobile Apps
- Developer
- DAX Commands and Tips
- Custom Visuals Development Discussion
- Health and Life Sciences
- Power BI Spanish forums
- Translated Spanish Desktop
- Training and Consulting
- Instructor Led Training
- Dashboard in a Day for Women, by Women
- Galleries
- Data Stories Gallery
- Themes Gallery
- Contests Gallery
- Quick Measures Gallery
- Notebook Gallery
- Translytical Task Flow Gallery
- TMDL Gallery
- R Script Showcase
- Webinars and Video Gallery
- Ideas
- Custom Visuals Ideas (read-only)
- Issues
- Issues
- Events
- Upcoming Events
To celebrate FabCon Vienna, we are offering 50% off select exams. Ends October 3rd. Request your discount now.
- Power BI forums
- Forums
- Get Help with Power BI
- Desktop
- Using Slicer and Chart to Show Historical Data
- Subscribe to RSS Feed
- Mark Topic as New
- Mark Topic as Read
- Float this Topic for Current User
- Bookmark
- Subscribe
- Printer Friendly Page
- Mark as New
- Bookmark
- Subscribe
- Mute
- Subscribe to RSS Feed
- Permalink
- Report Inappropriate Content
Using Slicer and Chart to Show Historical Data
Hi Everyone,
I have a table of activities that has the total slack for each activity at different dates. I want to display a chart using a measure that plots the total slack by date for all the dates up to the date I select in the slicer.
This is what I want to see:
This is what I get instead:
I cannot turn off the interactions between the slicer and the chart because I want the chart to change if I select a different date and I cannot change the slicer options to "between" or "multi-select" because of customer requirements.
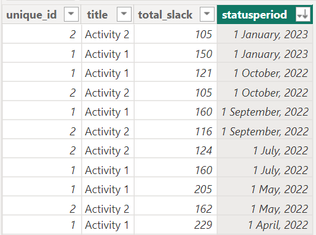
This is what my data looks like:
This is the measure I am currently using to display the slack trend:
slack trend =
CALCULATE(
    MAX(schedule[total_slack]),
    FILTER(
        schedule,
        schedule[statusperiod] = MAX(schedule[statusperiod])
    )
)
Thanks in advance!
Solved! Go to Solution.
- Mark as New
- Bookmark
- Subscribe
- Mute
- Subscribe to RSS Feed
- Permalink
- Report Inappropriate Content
@vsorensen , If you are filtering one value and want a trend of more than that , then the slicer needs to be on an independent table
//Date1 is independent Date table, Date is joined with Table
new measure =
var _max = maxx(allselected(Date1),Date1[Date])
var _min = _max -5
return
calculate( sum(Table[Value]), filter('Date', 'Date'[Date] >=_min && 'Date'[Date] <=_max))
Need of an Independent Date Table:https://www.youtube.com/watch?v=44fGGmg9fHI
- Mark as New
- Bookmark
- Subscribe
- Mute
- Subscribe to RSS Feed
- Permalink
- Report Inappropriate Content
Thank you for pointing me in the right direction. Ultimately I used this post to find a solution:


