cancel
Showing results for 
Search instead for 
Did you mean: 

Data Days is here! Join us now for 60+ days of learning, challenges, and connection. Learn more

Reply
akj2784
Post Partisan
Post Partisan

Using R Programming in Power BI

Hi All,


I want to write an R Program to create waterfall chart in Power BI. The reason I want to write is I don't want to show Total bar  as  the default waterfall chart in Power BI has.


So I have two columns in the dataset ( Category, Metric).


So the metric should split the data based on the category and plot it as waterfall chart showing the positive and negative values.


If I use ggplot2 I need to paas various arguments and not nececerraily I have all the arguments in the power bi dataset.

But using the columns I have , i want to create all other aguments.

And somehow I am not very clear on the syntax,

I am following the below blog and trying to replicate in power bi.


https://learnr.wordpress.com/2010/05/10/ggplot2-waterfall-charts/


Any help to show such example would be really appreciated.


Regards,


2 REPLIES 2
v-jiascu-msft
Microsoft Employee
Microsoft Employee

Hi @akj2784,


You can paste the R script and run it directly. If there is an error that could say lacking of packages, just install it.

The demo code from your link.

library(ggplot2)

dataset$desc <- factor(dataset$desc, levels = dataset$desc)
dataset$id <- seq_along(dataset$amount)
dataset$type <- ifelse(dataset$amount > 0, "in", "out")
dataset[dataset$desc %in% c("Starting Cash", "End Cash"), "type"] <- "net"
dataset$end <- cumsum(dataset$amount)
dataset$end <- c(head(dataset$end, -1), 0)
dataset$start <- c(0, head(dataset$end, -1))
dataset <- dataset[, c(3, 1, 4, 6, 5, 2)]
ggplot(dataset, aes(dataset$desc, fill = type)) + geom_rect(aes(x = dataset$desc, xmin = id - 0.45, xmax = id + 0.45, ymin = end, ymax = start))
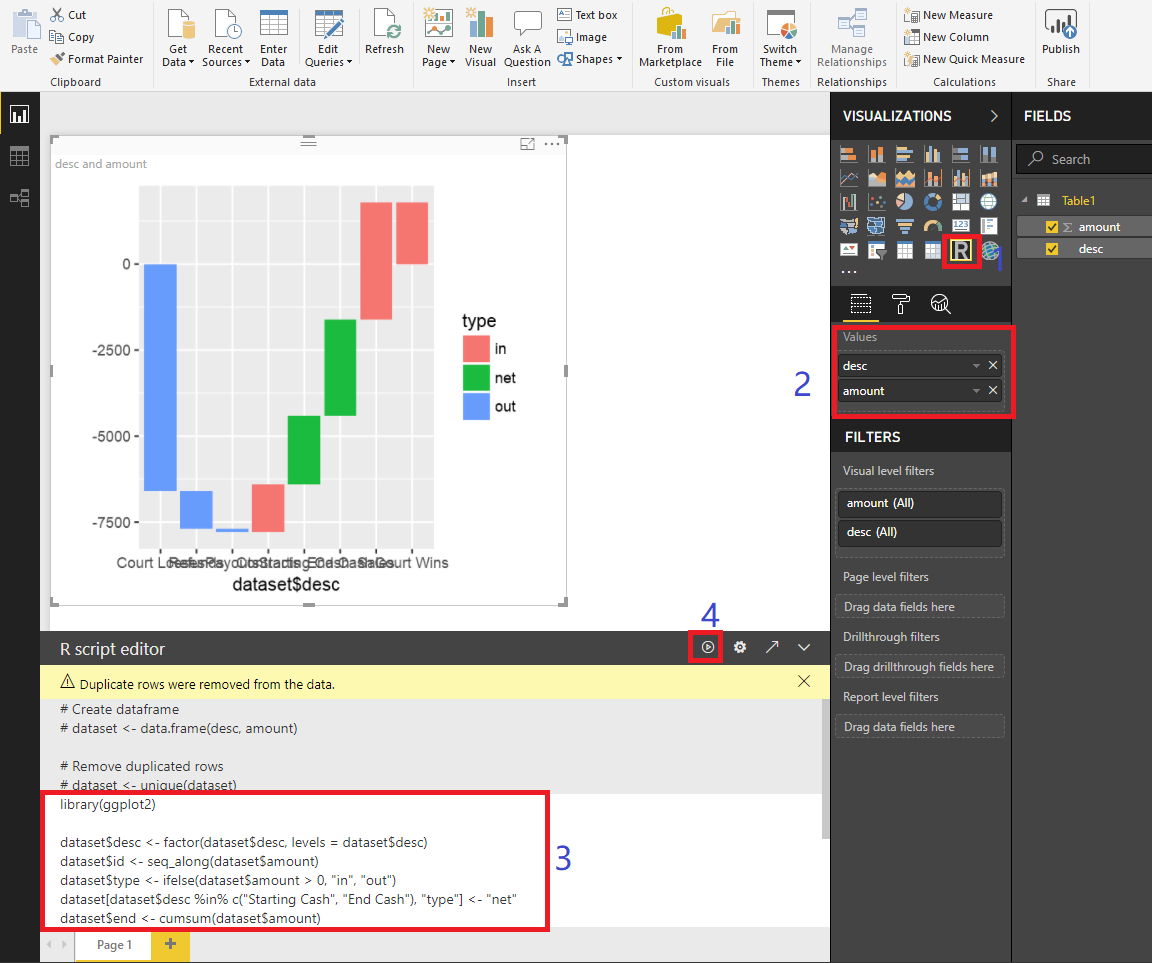
Using_R_Programming_in_Power_BI


Best Regards,

Dale

Community Support Team _ Dale
If this post helps, then please consider Accept it as the solution to help the other members find it more quickly.

Thank you for quick reply.


Assume desc variable is already present in my dataset which I have added from power bi fields. How do I refer that column in the calculation for the last line shown below.

I don't want to create a variable for the column which I already have it in my dataset.


dataset$desc <- factor(dataset$desc, levels = dataset$desc)
dataset$id <- seq_along(dataset$amount)
dataset$type <- ifelse(dataset$amount > 0, "in", "out")
dataset[dataset$desc %in% c("Starting Cash", "End Cash"), "type"] <- "net"


 Also if you can suggest any way to stack the bar on some other column.

Any help would be really appreciated. I know this is more of R question but just in case you have the answer handy.


Regards

Helpful resources

Announcements
Fabric Data Days is here Carousel

Fabric Data Days 2026

Don't miss out on Data Days, June 15 through August 7. Learn Fabric, Power BI, SQL, AI and more.

May Power BI Update Carousel

Power BI Monthly Update - May 2026

Check out the May 2026 Power BI update to learn about new features.

Power BI DataViz World Championships carousel

Power BI DataViz World Championships - June 2026

A new Power BI DataViz World Championship is coming this June! Don't miss out on submitting your entry.