cancel
Showing results for 
Search instead for 
Did you mean: 

A new Data Days event is coming soon! This time we’re going bigger than ever. Fabric, Power BI, SQL, AI and more. Don't miss out.

Reply
Anonymous
Not applicable

Using OR to filter a visual using two fields

Hi,


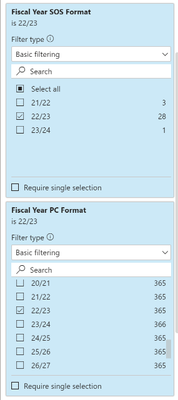
I am trying to filter a visual based on two fields but at the moment once the first one is applied the 2nd is restricted. 


I want the table to list values when either SOS = 22/23 OR PC = 22/23

FarhadA_0-1652801923415.png


At the moment once a select the first then the second is select is reduced. 


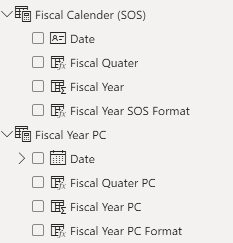
These are Dax calender tables.


Any help is much appricated.


Thank You

1 ACCEPTED SOLUTION
PaulDBrown
Community Champion
Community Champion

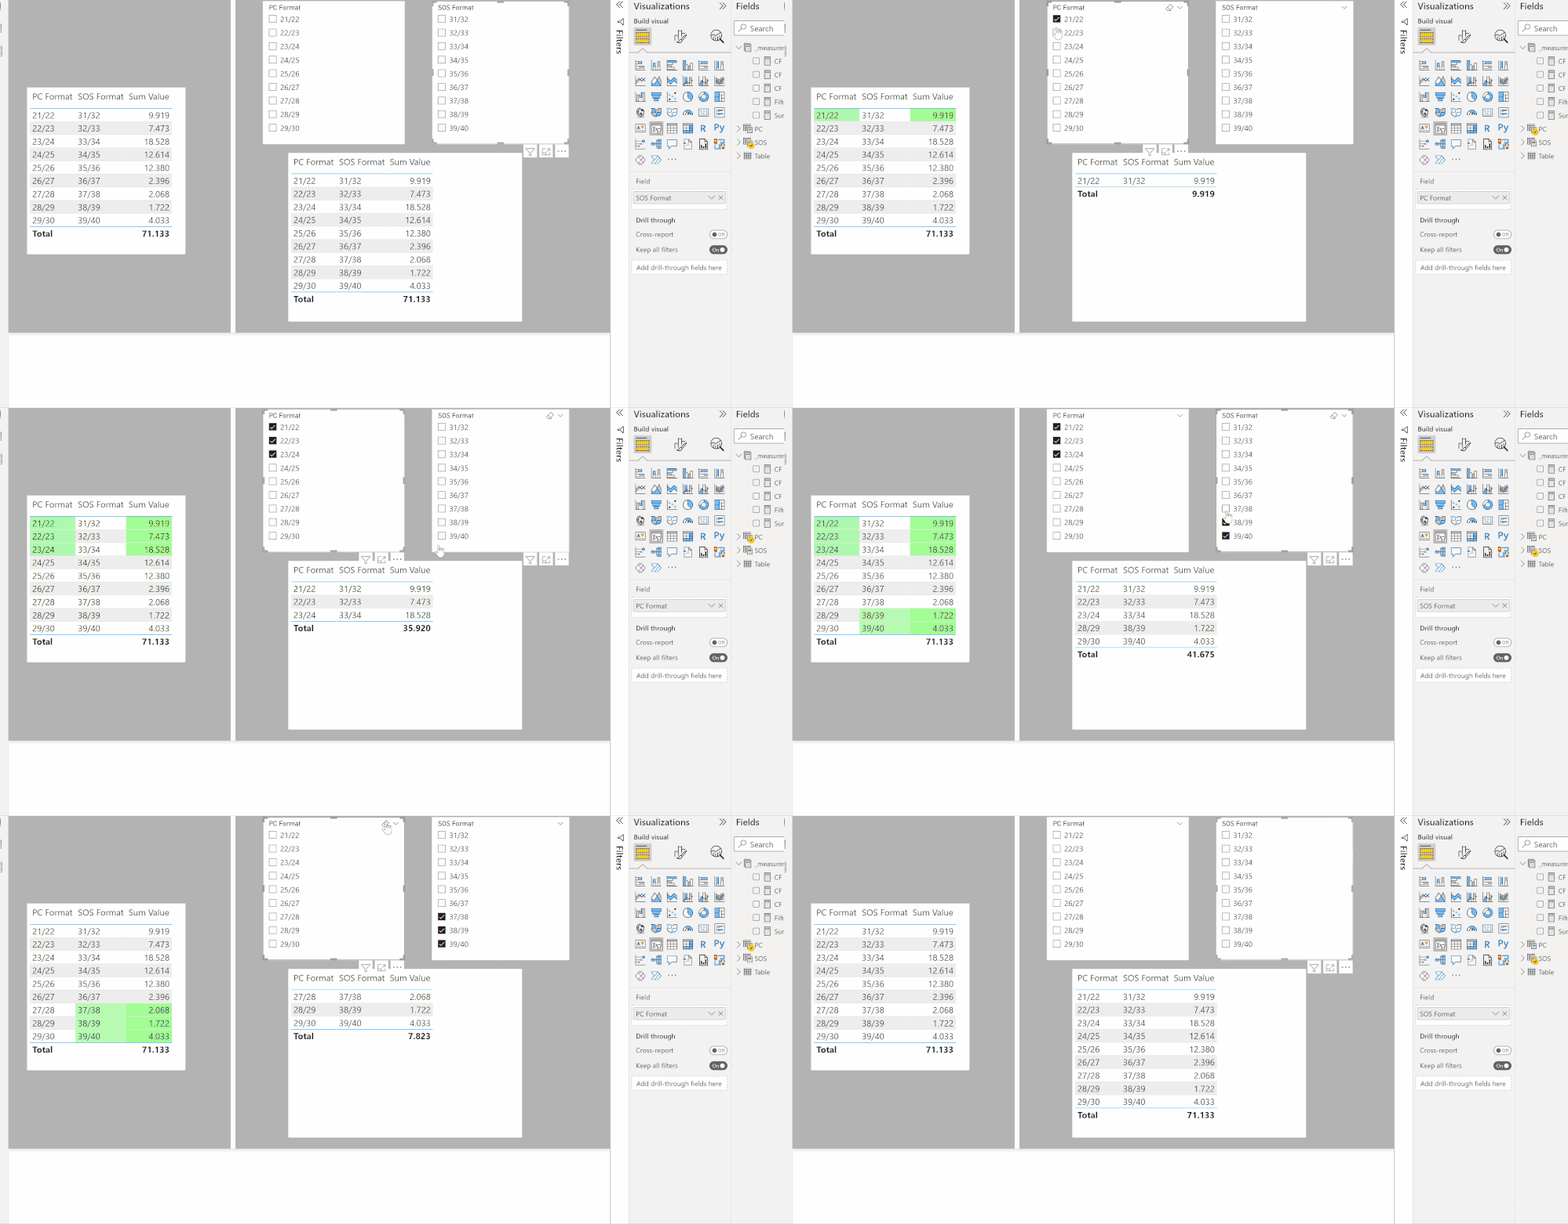
Here is one way. Create duplicates of the tables and leave them unrelated in the model. Use the fields of these unrelated tables as the slicers.

model.png


Then create the equivalent measure to use as a filter for the visual, setting the value to 1:


Filter Table =
SWITCH (
    TRUE (),
    AND (
        ISFILTERED ( PC ),
        MAX ( 'Table'[PC Format] ) IN VALUES ( PC[PC Format] )
    ), 1,
    AND (
        ISFILTERED ( SOS ),
        MAX ( 'Table'[SOS Format] ) IN VALUES ( SOS[SOS Format] )
    ), 1,
    AND ( NOT ( ISFILTERED ( PC ) ), NOT ( ISFILTERED ( SOS ) ) ), 1
)


FT.gif


I've attached a sample PBIX file


Did I answer your question? Mark my post as a solution!
In doing so, you are also helping me. Thank you!

Proud to be a Super User!
Paul on Linkedin.


View solution in original post

5 REPLIES 5
PaulDBrown
Community Champion
Community Champion

Can you try again? I actually edited the post and you may have tried while I was editing it

EDIT: I just tried the download and it works for me


Did I answer your question? Mark my post as a solution!
In doing so, you are also helping me. Thank you!

Proud to be a Super User!
Paul on Linkedin.


PaulDBrown
Community Champion
Community Champion

Here is one way. Create duplicates of the tables and leave them unrelated in the model. Use the fields of these unrelated tables as the slicers.

model.png


Then create the equivalent measure to use as a filter for the visual, setting the value to 1:


Filter Table =
SWITCH (
    TRUE (),
    AND (
        ISFILTERED ( PC ),
        MAX ( 'Table'[PC Format] ) IN VALUES ( PC[PC Format] )
    ), 1,
    AND (
        ISFILTERED ( SOS ),
        MAX ( 'Table'[SOS Format] ) IN VALUES ( SOS[SOS Format] )
    ), 1,
    AND ( NOT ( ISFILTERED ( PC ) ), NOT ( ISFILTERED ( SOS ) ) ), 1
)


FT.gif


I've attached a sample PBIX file


Did I answer your question? Mark my post as a solution!
In doing so, you are also helping me. Thank you!

Proud to be a Super User!
Paul on Linkedin.


Anonymous
Not applicable

Thank you, 


I tried to downloand the file but that doesn't seem to work, are you able to reupload it?

Anonymous
Not applicable

I'm unable to call the date table as they are Dax tables

FarhadA_0-1652807063721.png


amitchandak
Super User
Super User

@Anonymous , You need to create measures for that


example

countrows(filter(Table, Table[SOS] = "22/23" || Table[PC] = "22/23"))

Share with Power BI Enthusiasts: Full Power BI Video (20 Hours) YouTube
Microsoft Fabric Series 60+ Videos YouTube
Microsoft Fabric Hindi End to End YouTube

Helpful resources

Announcements
May Power BI Update Carousel

Power BI Monthly Update - May 2026

Check out the May 2026 Power BI update to learn about new features.

Fabric SQL PBI Data Days

Data Days 2026 coming soon!

Sign up to receive a private message when registration opens and key events begin.

New to Fabric survey Carousel

New to Fabric Survey

If you have recently started exploring Fabric, we'd love to hear how it's going. Your feedback can help with product improvements.

Power BI DataViz World Championships carousel

Power BI DataViz World Championships - June 2026

A new Power BI DataViz World Championship is coming this June! Don't miss out on submitting your entry.