Check your eligibility for this 50% exam voucher offer and join us for free live learning sessions to get prepared for Exam DP-700.
Get StartedDon't miss out! 2025 Microsoft Fabric Community Conference, March 31 - April 2, Las Vegas, Nevada. Use code MSCUST for a $150 discount. Prices go up February 11th. Register now.
When a table is dynamically segmented based on a measure, is there a way to retain that filtered subset to use with other measures?
Here's my scenario: I have a list of counties and using dynamic segmentation I created a measure that only returns a value if the county has JobOpenings:Unemployed ratio in the top 1% of all counties.
Selected Measure, Filtered by Pctile = VAR LocationsThatMeetCriteria = FILTER ( VALUES(DimCounties[CountyID]) ,COUNTROWS ( FILTER ( 'Percentile Ranges', [OpeningsToUnemployedPctile] > .99 && [OpeningsToUnemployedPctile] <= 1 ) ) > 0 ) RETURN CALCULATE ( [OpeningsToUnemployed] ,LocationsThatMeetCriteria )
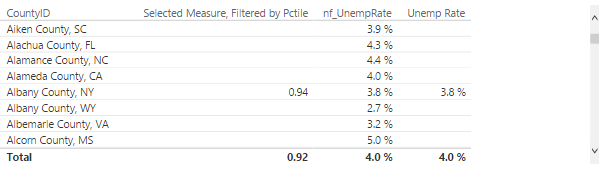
In the data table screenshot, you can see all counties in the first column. The second column shows a value if the county is in the top 1%. I wanted to create and display additional data points about the qualifying counties so I started by adding nf_UnempRate (see screenshot). The problem is that the measure doesn't consider the dynamic segmentation and returns values for all counties.
nf_UnempRate =
DIVIDE(
SUM('FactJobData'[Unemployed])
,SUM('FactJobData'[Civilian Labor Force])
,BLANK()
)
To solve that issue, I created UnempRate (see screenshot) which checks if "Selected Measure, Filtered by Pctile" is blank. If so, it returns blank too.
Unemp Rate =
IF(
[LocationFilteredOut]
,BLANK()
,[nf_UnempRate]
)
LocationFilteredOut = ISBLANK([Selected Measure, Filtered by Pctile])
This works great and when I remove "nf_UnempRate" my entire data table visual is properly filtered based on the parameter I pass for percentile. However when I add 6-7 similar columns, the performance slows to a crawl. Query Analyser shows 10,000+ steps in the logical query plan. It seems that each measure recalculates "Selected Measure, Filtered by Pctile" instead of re-using the results from the first time it was calculated.I thought that implementing Variables would solve this issue, but I can't reference a variable from another measure.
I'd like the filtered list of counties that are calculated from the first measure to be passed as the basis for calculating the other measures instead of having the system recalc that list of counties over and over again. Is there a way that you know of to accomplish this?
It seems that this feature request would solve my issue (https://ideas.powerbi.com/forums/265200-power-bi-ideas/suggestions/14950908-add-global-variables-to-... sadly is has few votes :(.
Thanks in advance!
Solved! Go to Solution.
I was able to resolve this on my own after further research.
To precalculate which counties qualify for a given measure/percentile combo, I used a calculated table using SQLBI's transition matrix strategy. Starting with a list of 3,000 counties, I used GENERATE to create the cartesian product of all possible filter measures used by dynamic segmentation as well as all possible percentile ranges, ending up with calcalated table of 120,000+ rows. I added a calculated column to this new table that returns 1 if county-measure combo fell within the percentile range for that row and 0 if not.
Next, I re-wrote each original measure (i.e. Unemp Rate) to only calculate for the rows in the calculated table that met the measure-percentile combo as per below:
Selected Measure, Filtered by Pctile = CALCULATE ( [Selected Measure] ,FILTER( FactJobData ,CONTAINS( FILTER( 'TransitionTable_CountiesPrecalculatedByPercentile' ,'TransitionTable_CountiesPrecalculatedByPercentile'[Measure Sort] = VALUES('Percentile Measures'[Sort]) && 'TransitionTable_CountiesPrecalculatedByPercentile'[Percentile Sort] = VALUES('Percentile Ranges'[Sort]) && 'TransitionTable_CountiesPrecalculatedByPercentile'[In Percentile Range?] = 1 ) ,'TransitionTable_CountiesPrecalculatedByPercentile'[CountyID], MAX(FactJobData[CountyID]) ) ) )
The performance boost was enormous. Previously, each time I'd change the slicers on my dashboard, it would take about 2-4 seconds to refresh the data table visual. When I analyzed the query profiler, 99% of the time was spent on the Formula Engine. Now that most of the pre-calculation was accomplished by the calculated table, changing slicers happens almost instantly. Here's the finished report.
Hi @Anonymous,
According to your description, I'd like to suggest you to try keepfilter function, below is the reference link:
KEEPFILTERS: a new DAX feature to correctly compute over arbitrary shaped sets
If above is not help, can you please share some sample data to test?
Regards,
Xiaoxin Sheng
Hi, thanks for taking the time to review my question!
I've looked at KEEPFILTERS before, and per your suggestion I reviewed it again. It didn't provide the optimization needed. My issue isn't that the filters are being dropped, it's that the filtered subset of Counties has to be recalculated for each measure and there's a large performance penalty.
How do I avoid recalculating the dynamic segmentation for qualifying counties for each subsequent measure?
I was able to resolve this on my own after further research.
To precalculate which counties qualify for a given measure/percentile combo, I used a calculated table using SQLBI's transition matrix strategy. Starting with a list of 3,000 counties, I used GENERATE to create the cartesian product of all possible filter measures used by dynamic segmentation as well as all possible percentile ranges, ending up with calcalated table of 120,000+ rows. I added a calculated column to this new table that returns 1 if county-measure combo fell within the percentile range for that row and 0 if not.
Next, I re-wrote each original measure (i.e. Unemp Rate) to only calculate for the rows in the calculated table that met the measure-percentile combo as per below:
Selected Measure, Filtered by Pctile = CALCULATE ( [Selected Measure] ,FILTER( FactJobData ,CONTAINS( FILTER( 'TransitionTable_CountiesPrecalculatedByPercentile' ,'TransitionTable_CountiesPrecalculatedByPercentile'[Measure Sort] = VALUES('Percentile Measures'[Sort]) && 'TransitionTable_CountiesPrecalculatedByPercentile'[Percentile Sort] = VALUES('Percentile Ranges'[Sort]) && 'TransitionTable_CountiesPrecalculatedByPercentile'[In Percentile Range?] = 1 ) ,'TransitionTable_CountiesPrecalculatedByPercentile'[CountyID], MAX(FactJobData[CountyID]) ) ) )
The performance boost was enormous. Previously, each time I'd change the slicers on my dashboard, it would take about 2-4 seconds to refresh the data table visual. When I analyzed the query profiler, 99% of the time was spent on the Formula Engine. Now that most of the pre-calculation was accomplished by the calculated table, changing slicers happens almost instantly. Here's the finished report.
March 31 - April 2, 2025, in Las Vegas, Nevada. Use code MSCUST for a $150 discount!
Check out the January 2025 Power BI update to learn about new features in Reporting, Modeling, and Data Connectivity.
User | Count |
---|---|
114 | |
74 | |
57 | |
47 | |
39 |
User | Count |
---|---|
167 | |
119 | |
61 | |
58 | |
51 |