Get Fabric or SQL Certified for Free.
Get certified for free when you join Fabric Data Days 2026 and dive into Fabric, Power BI, SQL, AI, and other essential data skills.
Join now- Power BI forums
- Get Help with Power BI
- Desktop
- Service
- Report Server
- Power Query
- Mobile Apps
- Developer
- DAX Commands and Tips
- Custom Visuals Development Discussion
- Health and Life Sciences
- Power BI Spanish forums
- Translated Spanish Desktop
- Training and Consulting
- Instructor Led Training
- Dashboard in a Day for Women, by Women
- Galleries
- Data Stories Gallery
- Themes Gallery
- Contests Gallery
- QuickViz Gallery
- Quick Measures Gallery
- Visual Calculations Gallery
- Fabric Apps Gallery
- Notebook Gallery
- Translytical Task Flow Gallery
- TMDL Gallery
- R Script Showcase
- Webinars and Video Gallery
- Ideas
- Custom Visuals Ideas (read-only)
- Issues
- Issues
- Events
- Upcoming Events
July 28 - August 9 | Final Round of the Power BI Dataviz World Championships. This is your chance. Learn more
- Power BI forums
- Forums
- Get Help with Power BI
- Desktop
- Using DAX for Conditional Formatting
- Subscribe to RSS Feed
- Mark Topic as New
- Mark Topic as Read
- Float this Topic for Current User
- Bookmark
- Subscribe
- Printer Friendly Page


- Mark as New
- Bookmark
- Subscribe
- Mute
- Subscribe to RSS Feed
- Permalink
- Report Inappropriate Content
Using DAX for Conditional Formatting
I am trying to create the table below in PBi (without the Ref Target column). 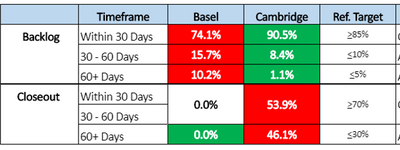
1. Trying to control conditional formatting using DAX. I am currently using the DAX formula below:
This is putting the colors into the visual but not correctly. It currently gives me the following output:
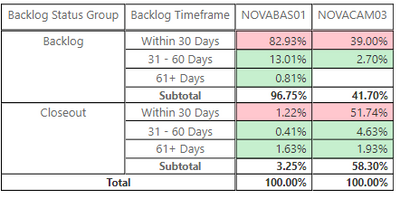
I have played around with the order of the Switch statement, but it either gives me the top as green and the rest red, or the top red and the rest green. Nothing according to the percentages. I am using "show as percent of column total" to get the percentages.
Secondly, I need to add into that DAX statement whether or not it is considered Backlog or Closeout, since the reference targets are different depending on the group.
To sum up, I need to use conditional formatting to show red or green based on whether it's hitting the specified reference target and backlog or closeout. Is this possible?
I am no PBi expert, so please bear with me. I appreciate any advice. Thanks!
BONUS POINTS - If you can figure out how to make the blank cells either say N/A, 0.0% or grayed out?
Solved! Go to Solution.
- Mark as New
- Bookmark
- Subscribe
- Mute
- Subscribe to RSS Feed
- Permalink
- Report Inappropriate Content
Sorry I didn't get a chance to put up some sample data. I was able to figure it out.
First I needed a measure to get the values I needed:
Thank you for your attempted assistance.
- Mark as New
- Bookmark
- Subscribe
- Mute
- Subscribe to RSS Feed
- Permalink
- Report Inappropriate Content
Good afternoon - I am trying to use the logic below, and it appears to work well, but when I go to change the background format to use my new Color measure, its not able to be selected. Any idea what I might be doing wrong?

- Mark as New
- Bookmark
- Subscribe
- Mute
- Subscribe to RSS Feed
- Permalink
- Report Inappropriate Content
Solved my issue - Have to set it as a text field. Works great!
- Mark as New
- Bookmark
- Subscribe
- Mute
- Subscribe to RSS Feed
- Permalink
- Report Inappropriate Content
Sorry I was late seeing this. Glad you figured it out!


- Mark as New
- Bookmark
- Subscribe
- Mute
- Subscribe to RSS Feed
- Permalink
- Report Inappropriate Content
Where are you entering/using this DAX? I was unaware you could control the colors of cells directly with a measure. Could you share an example .pbix of your current setup? Even if you have to fake some data, it would be very useful.
For the bonus point question, what measure(s) are you currently using to fill in this table? Usually just adding +0 to the measure will add a zero instead of a blank to a table.
- Mark as New
- Bookmark
- Subscribe
- Mute
- Subscribe to RSS Feed
- Permalink
- Report Inappropriate Content
Hi Cmcmahan, In order to use a measure for conditional formatting, you need to go to the conditional formatting within the formating section of your visual. From there you want to choose Field Value, and then place the measure you are using in the Based on Field. See below:
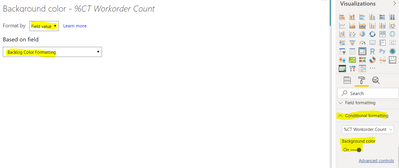
Hope this helps.
- Mark as New
- Bookmark
- Subscribe
- Mute
- Subscribe to RSS Feed
- Permalink
- Report Inappropriate Content
AHH, that's how that is supposed to work. I've always used rules, to format fields.
Could you share some sample data that we can copy/paste? Scrub names/proprietary info if you need to, but figuring out issues (especially with aggregations) is always MUCH easier with a test sample of raw data.
If not, let me know, and I can try and fake up some data that will probably(?) behave the same.
- Mark as New
- Bookmark
- Subscribe
- Mute
- Subscribe to RSS Feed
- Permalink
- Report Inappropriate Content
Sorry I didn't get a chance to put up some sample data. I was able to figure it out.
First I needed a measure to get the values I needed:
Thank you for your attempted assistance.

Helpful resources

Fabric Community Sticker Challenge - Barcelona 2026
If you love stickers, then you will definitely want to check out our community sticker challenge, Barcelona edition!

Power BI Monthly Update - July 2026
Check out the July 2026 Power BI update to learn about new features.

Power BI DataViz World Championships - June 2026
A new Power BI DataViz World Championship is coming this June! Don't miss out on submitting your entry.

| User | Count |
|---|---|
| 28 | |
| 28 | |
| 20 | |
| 19 | |
| 19 |


| User | Count |
|---|---|
| 35 | |
| 26 | |
| 19 | |
| 18 | |
| 17 |


