Get certified for free when you join Fabric Data Days 2026 and dive into Fabric, Power BI, SQL, AI, and other essential data skills.
Join nowJuly 7 - July 17 | Round 2 of the Power BI Dataviz World Championships. Don't miss your chance! Learn more
Hi,
I'm trying to relate two queries and count the number of times a Motorist Assist is On Scene using Event Id's from the eventlist.csv correspond with the Event Id in the responders.csv file. I'm able to chart the Incidents with lane blockage column but I need to chart the number of Event Id's that anytime at least a single Motorist Assists On Scene and the Percentage lable. Is this possible? These numbers arThanks in advance for your consideration.
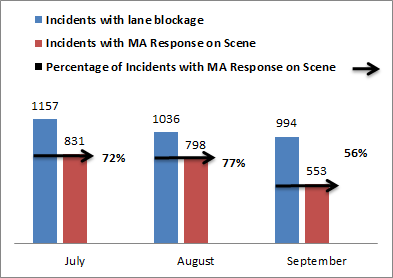
The final table should look something like this;
Both files can be viewed here; https://www.dropbox.com/s/v0anfdctqsaw0gh/Ex%20responders.zip?dl=0
Solved! Go to Solution.
Hi @Anonymous ,
Would you please create a relationship between table1 and table2 by 'Event Id' column? And you can use the following two measure for your chart:
Incidents with Lane Blockage = COUNT(Table1[Event Id])
Incidents with Motorists Assist On Scene = CALCULATE(COUNT(Table1[Event Id]), FILTER(RELATEDTABLE(Table2),Table2[Responder Type] = "Motorist Assist"))For more details ,please refer to the pbix file: https://qiuyunus-my.sharepoint.com/:u:/g/personal/pbipro_qiuyunus_onmicrosoft_com/EetDHgCtdZhOukrTNK...
If this post help, please consider accept it as the solution to help other member find it more quickly.
Best Regards,
Dedmon Dai
Hi @Anonymous ,
Would you please create a relationship between table1 and table2 by 'Event Id' column? And you can use the following two measure for your chart:
Incidents with Lane Blockage = COUNT(Table1[Event Id])
Incidents with Motorists Assist On Scene = CALCULATE(COUNT(Table1[Event Id]), FILTER(RELATEDTABLE(Table2),Table2[Responder Type] = "Motorist Assist"))For more details ,please refer to the pbix file: https://qiuyunus-my.sharepoint.com/:u:/g/personal/pbipro_qiuyunus_onmicrosoft_com/EetDHgCtdZhOukrTNK...
If this post help, please consider accept it as the solution to help other member find it more quickly.
Best Regards,
Dedmon Dai
Hi,
Your question is not clear. Show the result in a simple table format. From there, we can build any visual that we want.
Sure. I have 2 queries that I'm working with. The files available in dropbox are reduced versions of each table that contain the same column headings.
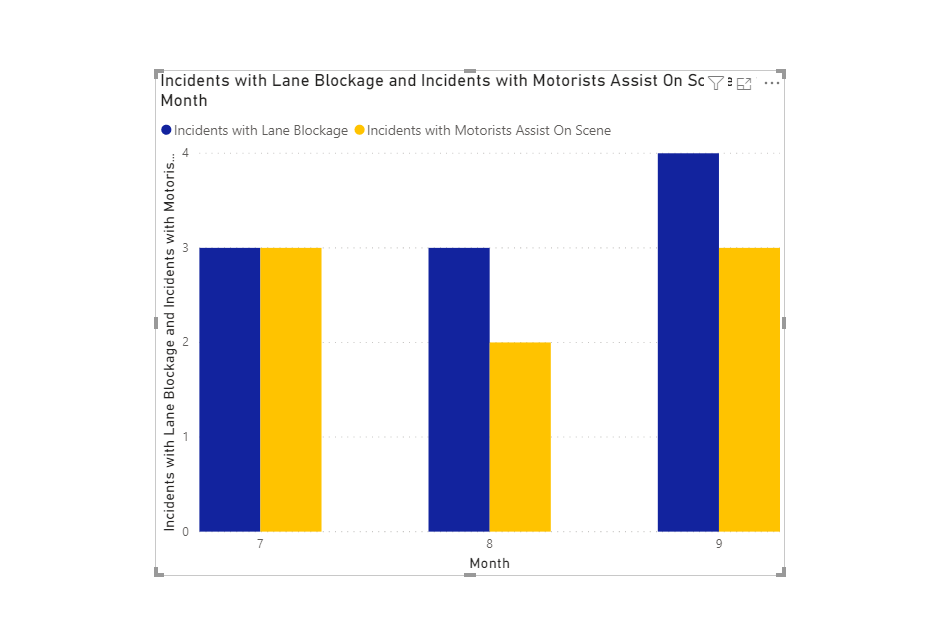
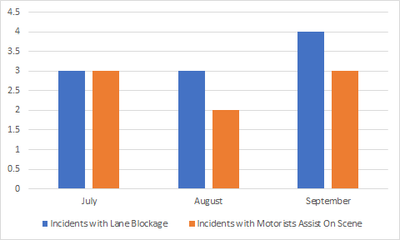
The first table provides the count of Event Ids and plotted as the 'Incidents with Lane Blockage' per month. For this example, there are 3, 3, & 4 Event Ids counted for July, August, September, respectively.
https://www.dropbox.com/s/xfobpkmwlfedc7w/Ex%20eventsList.csv?dl=0
The Event Ids of the 1st table need to be compared to the 'Event Id' column of my 2nd table. If the Event Id of the 1st table exists in the 2nd table AND a 'Motorist Assist' entry exists in the 'Responder Type' column, then it should be counted and able to be plotted as 'Incidents with Motorists Assist On Scene' per month. In this example there are 3, 2, & 3, respectively.
https://www.dropbox.com/s/u0p554a9hzmwzsf/Ex%20responders.csv?dl=0
Here is the final result I'm looking for.
Thanks in advance for your help.
Join us in Barcelona for FabCon and SQLCon, the Fabric, Power BI, SQL, and AI community event. Save €200 with code FABCMTY200.
Join Data Days 2026: 60 days of free live/on-demand sessions, challenges, study groups, and certification opportunities.
| User | Count |
|---|---|
| 26 | |
| 23 | |
| 19 | |
| 18 | |
| 15 |
| User | Count |
|---|---|
| 47 | |
| 44 | |
| 43 | |
| 35 | |
| 31 |