Join us at FabCon Vienna from September 15-18, 2025
The ultimate Fabric, Power BI, SQL, and AI community-led learning event. Save €200 with code FABCOMM.
Get registered- Power BI forums
- Get Help with Power BI
- Desktop
- Service
- Report Server
- Power Query
- Mobile Apps
- Developer
- DAX Commands and Tips
- Custom Visuals Development Discussion
- Health and Life Sciences
- Power BI Spanish forums
- Translated Spanish Desktop
- Training and Consulting
- Instructor Led Training
- Dashboard in a Day for Women, by Women
- Galleries
- Data Stories Gallery
- Themes Gallery
- Contests Gallery
- Quick Measures Gallery
- Notebook Gallery
- Translytical Task Flow Gallery
- TMDL Gallery
- R Script Showcase
- Webinars and Video Gallery
- Ideas
- Custom Visuals Ideas (read-only)
- Issues
- Issues
- Events
- Upcoming Events
Compete to become Power BI Data Viz World Champion! First round ends August 18th. Get started.
- Power BI forums
- Forums
- Get Help with Power BI
- Desktop
- Trend line in chart with custom x-axis not working...
- Subscribe to RSS Feed
- Mark Topic as New
- Mark Topic as Read
- Float this Topic for Current User
- Bookmark
- Subscribe
- Printer Friendly Page
- Mark as New
- Bookmark
- Subscribe
- Mute
- Subscribe to RSS Feed
- Permalink
- Report Inappropriate Content
Trend line in chart with custom x-axis not working properly
Hi everyone,
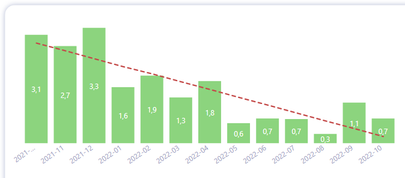
I have a dashboard with a Combo Chart that displays agregated calculations for the previous 13 months. I added a trend line in DAX that works pretty well in the monthly chart.
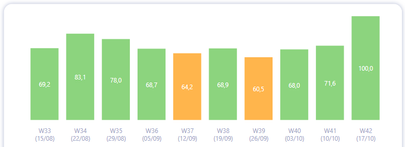
I also have the same dashboard for the previous 13 weeks. The weekly chart is slightly different from the monthly chart because the x-axis is not a date but a custom string done in DAX with the following format : "Week number (first date of week)"
My DAX trend mesure doesn't work for my weekly chart and outputs the following error : "Calculation error in measure [Weekly Trend]: The function SUMX cannot work with values of type String"
The weekly trend mesure is the one below, the y-axis values in the chart are from the measure [AGREGATED VALUE], the x-axis being 'T_DATES_GRAPH'[Weekly Axis] :
Weekly Trend =
VAR Known = FILTER(
        SELECTCOLUMNS(ALLSELECTED('T_DATES_GRAPH'[Weekly Axis]),"Known[X]", 'T_DATES_GRAPH'[Weekly Axis],"Known[Y]", [AGREGATED VALUE]),
        AND(NOT(ISBLANK(Known[X])), NOT(ISBLANK(Known[Y])))
    )
VAR Count_Items = COUNTROWS(Known)
VAR Sum_X = SUMX(Known, Known[X])
VAR Sum_X2 = SUMX(Known, Known[X]^2)
VAR Sum_Y = SUMX(Known, Known[Y])
VAR Sum_XY = SUMX(Known, Known[X] * Known[Y])
VAR Average_X = AVERAGEX(Known, Known[X])
VAR Average_Y = AVERAGEX(Known, Known[Y])
VAR Slope = DIVIDE(Count_Items * Sum_XY - Sum_X * Sum_Y,Count_Items * Sum_X2 - Sum_X^2)
VAR Intercept = Average_Y - Slope * Average_X
RETURN
AVERAGEX(DISTINCT('T_DATES_GRAPH'[Weekly Axis]), Intercept + Slope * 'T_DATES_GRAPH'[Weekly Axis])
The [Weekly Axis] is a calcuted column with the following measure, DATEP being the last date of the week
Weekly Axis = "W" & [WeekNumber] & " (" & FORMAT([DATEP],"dd/mm") & ")"
The problem probably resides in the fact that for my Weekly Trend measure DAX can't properly order an x-axis with string values, but it works with date values.
I can't get my head around this... If someone knows how to solve or bypass such a problem it would greatly help me!
Solved! Go to Solution.
- Mark as New
- Bookmark
- Subscribe
- Mute
- Subscribe to RSS Feed
- Permalink
- Report Inappropriate Content
For anyone interested I managed to solve it. The trick was to get the measure to work with a date range while leaving the x-axis of the chart with my custom measure (Week number + first day of week). I had to include both those fields in the SELECTCOLUMNS and it works like a charm. See the corrected measure below:
Weekly Trend =
VAR Known = FILTER(
        SELECTCOLUMNS(ALLSELECTED('T_DATES_GRAPH'[DATEP],'T_DATES_GRAPH'[Weekly X Axis]),"Known[X1]",'T_DATES_GRAPH'[DATEP],"Known[X2]",'T_DATES_GRAPH'[Weekly X Axis],"Known[Y]",[AGREGATED VALUE]),
        AND(NOT(ISBLANK(Known[X1])), NOT(ISBLANK(Known[Y])))
    )
VAR Count_Items = COUNTROWS(Known)
VAR Sum_X = SUMX(Known, Known[X1])
VAR Sum_X2 = SUMX(Known, Known[X1]^2)
VAR Sum_Y = SUMX(Known, Known[Y])
VAR Sum_XY = SUMX(Known, Known[X1] * Known[Y])
VAR Average_X = AVERAGEX(Known, Known[X1])
VAR Average_Y = AVERAGEX(Known, Known[Y])
VAR Slope = DIVIDE(Count_Items * Sum_XY - Sum_X * Sum_Y,Count_Items * Sum_X2 - Sum_X^2)
VAR Intercept = Average_Y - Slope * Average_X
RETURN
AVERAGEX(DISTINCT('T_DATES_GRAPH'[DATEP]), Intercept + Slope * 'T_DATES_GRAPH'[DATEP])- Mark as New
- Bookmark
- Subscribe
- Mute
- Subscribe to RSS Feed
- Permalink
- Report Inappropriate Content
Hi @AntoineC ,
Unfortunatelly, the function SUMX cannot work with values of type String.
Please change type of [Week] column to whole number:
In my test, it works fine:
Best regards,
Yadong Fang
If this post helps, then please consider Accept it as the solution to help the other members find it more quickly.
- Mark as New
- Bookmark
- Subscribe
- Mute
- Subscribe to RSS Feed
- Permalink
- Report Inappropriate Content
Hi Yadong Fang,
Thanks for your answer. Unfortunately I can't use the Week Number as the x-axis in my chart. I absolutely need to use the week number and the first day of the week, for user experience purposes.
That's why I need to use my calculated column [Weekly Axis]
Weekly Axis = "W" & [WeekNumber] & " (" & FORMAT([DATEP],"dd/mm") & ")"So I'm wondering if there is a way in my DAX trend mesure [Weekly Trend] to bypass this problem, maybe convert the string to an order integer?
Helpful resources
| User | Count |
|---|---|
| 80 | |
| 78 | |
| 37 | |
| 34 | |
| 31 |
| User | Count |
|---|---|
| 93 | |
| 81 | |
| 60 | |
| 49 | |
| 49 |


