Join us at FabCon Vienna from September 15-18, 2025
The ultimate Fabric, Power BI, SQL, and AI community-led learning event. Save €200 with code FABCOMM.
Get registered- Power BI forums
- Get Help with Power BI
- Desktop
- Service
- Report Server
- Power Query
- Mobile Apps
- Developer
- DAX Commands and Tips
- Custom Visuals Development Discussion
- Health and Life Sciences
- Power BI Spanish forums
- Translated Spanish Desktop
- Training and Consulting
- Instructor Led Training
- Dashboard in a Day for Women, by Women
- Galleries
- Data Stories Gallery
- Themes Gallery
- Contests Gallery
- Quick Measures Gallery
- Notebook Gallery
- Translytical Task Flow Gallery
- TMDL Gallery
- R Script Showcase
- Webinars and Video Gallery
- Ideas
- Custom Visuals Ideas (read-only)
- Issues
- Issues
- Events
- Upcoming Events
Enhance your career with this limited time 50% discount on Fabric and Power BI exams. Ends August 31st. Request your voucher.
- Power BI forums
- Forums
- Get Help with Power BI
- Desktop
- Transforming values in a single column to column h...
- Subscribe to RSS Feed
- Mark Topic as New
- Mark Topic as Read
- Float this Topic for Current User
- Bookmark
- Subscribe
- Printer Friendly Page
- Mark as New
- Bookmark
- Subscribe
- Mute
- Subscribe to RSS Feed
- Permalink
- Report Inappropriate Content
Transforming values in a single column to column header
I have the following data
| Product ID | Year Shipped | Month Shipped | $ |
Month has values: Jan, Feb, Mar ... Nov, Dec
Need to transform this to:
| Product ID | Year Shipped | Jan | Feb | Mar | Apr | ... | Nov | Dec | $ |
Given that I am a newbie at Power BI, would appreciate pointers that a newbie can follow.
Many thanks!
Solved! Go to Solution.
- Mark as New
- Bookmark
- Subscribe
- Mute
- Subscribe to RSS Feed
- Permalink
- Report Inappropriate Content
Hi @vips ,
I'm not sure whether you need to change your data model or show your data like that?
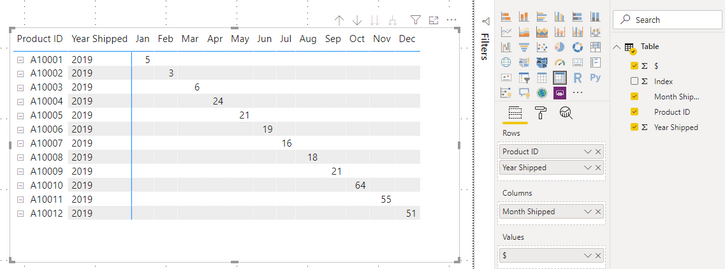
If you don't need to change your data model, you can use Matrix to make it like the below screenshot.
Aiolos Zhao
- Mark as New
- Bookmark
- Subscribe
- Mute
- Subscribe to RSS Feed
- Permalink
- Report Inappropriate Content
Hi,
According to your description, it is easily to reach your requirement by using matrix visual.
Here is my test table:
Then choose a matrix visual and turn off Stepped layout for Row headers:
The result shows:
Hope this helps.
Best Regards,
Giotto Zhi
- Mark as New
- Bookmark
- Subscribe
- Mute
- Subscribe to RSS Feed
- Permalink
- Report Inappropriate Content
And if you want to change your data model, you can use the Pivot function in the Power Query Editor.
1. Select the Month Shipped column
2. Click Pivot Column in Transform tab
3. Choose $ column, click OK
Aiolos Zhao
- Mark as New
- Bookmark
- Subscribe
- Mute
- Subscribe to RSS Feed
- Permalink
- Report Inappropriate Content
The best you can do
Product , year shipped, jan , feb , mar.
In case you need another column at the end, then you might have created a static column that will not be dynamic
I already submitted an idea for that please vote
https://ideas.powerbi.com/forums/265200-power-bi-ideas/suggestions/39773011-hybrid-table
Appreciate your Kudos.
- Mark as New
- Bookmark
- Subscribe
- Mute
- Subscribe to RSS Feed
- Permalink
- Report Inappropriate Content
Hi @vips ,
I'm not sure whether you need to change your data model or show your data like that?
If you don't need to change your data model, you can use Matrix to make it like the below screenshot.
Aiolos Zhao
- Mark as New
- Bookmark
- Subscribe
- Mute
- Subscribe to RSS Feed
- Permalink
- Report Inappropriate Content
This worked great!! Thanks!


