This is best Fabric, Power BI, SQL and AI community event. How do we know? The last event sold out! Save €200 with code FABCMTY200.
Register nowA new Data Days event is coming soon! This time we’re going bigger than ever. Fabric, Power BI, SQL, AI and more. Don't miss out.
Hello,
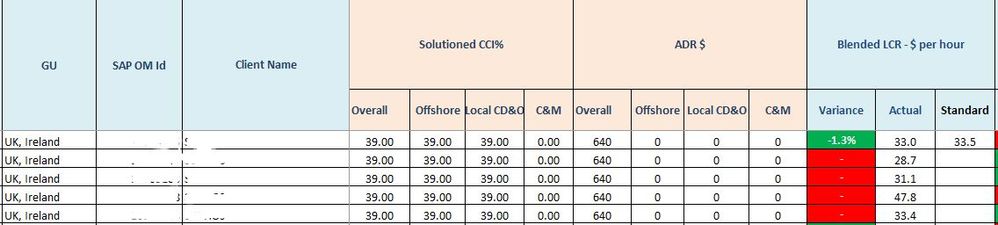
Can you please help to create the below table layout in power bi.
Thanks in advance for any assistance....
Hi @yashish68,
It depends on how is your source data structured and how is the value calculated.
How to Get Your Question Answered Quickly
Regards,
Yuliana Gu
Hi @v-yulgu-msft ,
Thank you for your reply.
In the attahced screenshot, GU, SAPOMID and Client Name are columns present in database where as Overall, Offshore, Local CD& D, C&M are calculated fields based on Solution CCI% and ADR$ columns respectively.
I just want to know whether the table/matrix layout as shown in screenshot is possible or not.
Please let me know if there is any workaround for the same.
Thanks & Regards,
Ashish Yadav
Hi @yashish68,
A Matrix visual might meet your requirement. Also, I think instead of calculated columns, create Overall, Offshore, Local CD& D, C&M via measures would be better. You can place GU, SAPOMID and Client Name in "rows", place Solution CCI% and ADR$ in "columns", and place those measures in "values".
Regards,
Yuliana Gu
Check out the May 2026 Power BI update to learn about new features.
Sign up to receive a private message when registration opens and key events begin.
If you have recently started exploring Fabric, we'd love to hear how it's going. Your feedback can help with product improvements.
| User | Count |
|---|---|
| 29 | |
| 25 | |
| 25 | |
| 21 | |
| 14 |
| User | Count |
|---|---|
| 59 | |
| 50 | |
| 25 | |
| 20 | |
| 20 |